Original Article 2, Issue 8.4
An Exploratory In Vitro Study of the Effect on Pharyngograms of Acoustic Leaks Through the Velopharyngeal Port
http://dx.doi.org/10.15331/jdsm.7214John Viviano, DDS1; Kurt Nikander, PhD2; Dirk von Hollen, BSc3; El Hassane Larhrib, PhD4
1 Sleep Disorders Dentistry Inc., Mississauga, Ontario, Canada; 2 InDevCo AB, Nyköping, Sweden; 3 Philips RS North America LLC formerly known as Respironics, Inc., a Delaware limited liability company (“Philips”), Pittsburgh, PA, USA; 4 University of Huddersfield, Department of Pharmacy, Queensgate, Huddersfield, HD1 3DH, United Kingdom
ABSTRACT
Study Objectives:
A nasopharyngeal seal of the velopharyngeal port is important during swallowing and speaking. An acoustic leak through an open velopharyngeal port has also been reported as a source for overestimations of acoustic pharyngograms. Quantitative data on the effects of the size of the acoustic leak on the pharyngogram has not been published. The current exploratory in vitro study was designed to measure the effects of increasing sizes of a nasopharyngeal acoustic leak on the pharyngogram.
Methods:
A plastic cast of the human upper airway constructed from a postmortem anatomic casting without a nasal cavity was used in the study. Acoustic leaks through a velopharyngeal port, created ~9 cm from the mouth, were mimicked using 12 different sizes of an open velopharyngeal port with areas ranging from 7.1 mm2 to 1.54 cm2. Nasal cavities of either 20 mL or 30 mL were attached to the open velopharyngeal port. Acoustic pharyngometry was used to measure the size of the cast and the nasal cavities per each open velopharyngeal port size in terms of cross-sectional areas (CSA1-2) and volume (area under the curve; AUC1-3).
Results:
The effect of the size of the acoustic leak was statistically significant for all CSAs (P<0.0001) and AUCs (P<0.0001), whereas the effect of the acoustic leak with addition of the nasal cavities was statistically significant only for CSA2 (P<0.0001), AUC2 (P<0.0001), and AUC3 (P<0.0001).
Conclusions:
An acoustic leak through an open velopharyngeal port created an overestimation of the volume of the upper airways as displayed on the pharyngogram. Even small acoustic leaks seemed to have an effect on the pharyngogram. The main effect of the open velopharyngeal port appeared to occur distal to the acoustic leak and was influenced by both the size of the acoustic leak, and the volume of area being leaked into.
Keywords:
acoustic pharyngometry; cast; in vitro; nasopharyngeal acoustic leak; open velopharyngeal port; upper airways
Citation:
Viviano J, Nikander K, von Hollen D, Lahrib EH. An exploratory in vitro study of the effect on pharyngograms of acoustic leaks through the velopharyngeal port. J Dent Sleep Med. 2021;8(4)
INTRODUCTION
Acoustic pharyngometry is an inexpensive, noninvasive technology through which the upper airway size can be quantified.1-5 Figure 1 relates anatomic landmarks of the typical pharyngogram waveform, which represents the captured data, to the actual upper airway anatomy. Nose clips have often been used to help ensure oral breathing during the recording of pharyngograms; however, there is limited information on the possible effect of their use on the captured data. Rubinstein et al did not find any significant difference in mean pharyngeal, glottal, or tracheal areas following use of a nose clip or not.6 In contrast, Molfino et al suggested that the use of nose clips during the recordings might lead to an “open velum” (an open velopharyngeal port and therefore a lack of a nasopharyngeal seal), which would result in an overestimation of the distal pharynx, glottis, and trachea.7 The reason for the overestimation was assumed to be a nasopharyngeal acoustic leak; that is, sound waves propagating through the open velopharyngeal port into the nasopharynx and the paranasal sinuses influencing the data in an additive manner; the acoustic pulses returning from the nasal airways would then be added to those returning from the pharynx, glottis, and trachea creating a falsely large measurement of airway areas. Area overestimation distal to an acoustic leak has also been documented to occur with rhinometry measurements of the nasal cavity, where sound waves crossing the midline to the other nasal cavity result in an overestimation of area distal to the acoustic leak.8, 9 For pharyngometry, Molfino et al found that addition of nose clips frequently resulted in an open velopharyngeal port, that removal of the nose clips may result in closure of the velopharyngeal port, and that opening of the velopharyngeal port “is sometimes quite subtle and may be difficult to recognize”. All of these scenarios create challenges when evaluating a patient’s pharyngograms to make clinically significant decisions.7
Marshall et al presented the effects of different velopharyngeal port positions on pharyngograms.10 A mix of oral and nasal breathing placed the velum (soft palate) in an intermediate position, which could create an open velopharyngeal port effect. The cross-sectional area (CSA) of the oropharyngeal junction did not change, whereas the CSAs of the epiglottis and the glottis increased and the area under the curve (AUC) increased. Based on the graphic presentations of the waveforms in the studies by Molfino et al and Marshall et al, the increase of the CSAs could be quite variable, with increases of 4 cm2 to 14 cm2 and 2 cm2 to 5 cm2.7,10 Kamal described the velopharyngeal port as the port to the nasopharynx and stated that an open velopharyngeal port would pass acoustic pulses from the pharyngometer wavetube further up through the nasopharynx into the nasal cavities creating a type of acoustic leak.11, 12 The consequence would be an overestimation of the assumed oropharyngeal CSA.
It would be difficult to reproducibly evaluate the “open velum” hypothesis in subjects without complete control of the velopharyngeal port eliminating nasopharyngeal acoustic leaks during a series of pharyngometer recordings. An in vitro study design would be preferable as controlled acoustic pharyngometer recordings could be made with a surrogate for a closed or an open velopharyngeal port. A cast of the human upper airway similar to the polyester resin cast presented by Cheng et al could be used in order to mimic both closed and open velopharyngeal ports.13, 14
It is hypothesized that an open velopharyngeal port would pass acoustic impulses from the wavetube into a nasal cavity, creating a form of acoustic leak during acoustic pharyngometer recordings. The consequence would be an overestimation of the volume of the upper airways as displayed on the pharyngogram.
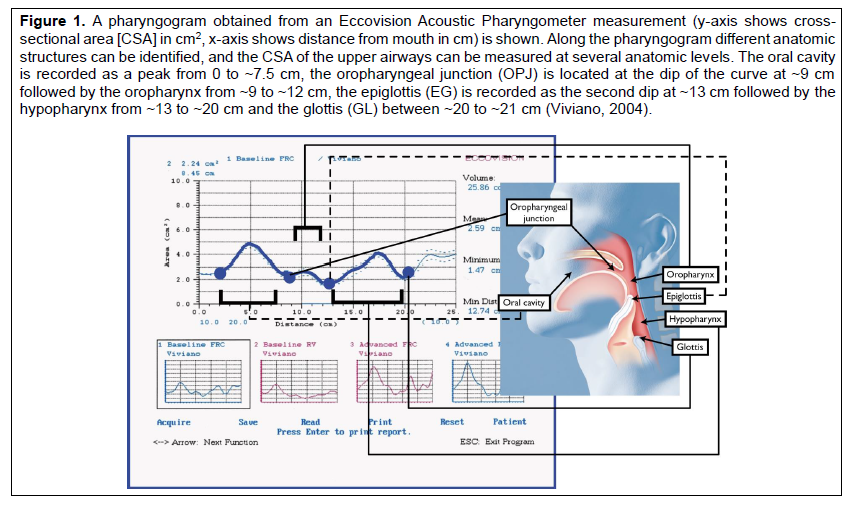
Figure 1A pharyngogram obtained from an Eccovision Acoustic Pharyngometer measurement (y-axis shows cross-sectional area [CSA] in cm2, x-axis shows distance from mouth in cm) is shown. Along the pharyngogram different anatomic structures can be identified, and the CSA of the upper airways can be measured at several anatomic levels. The oral cavity is recorded as a peak from 0 to ~7.5 cm, the oropharyngeal junction (OPJ) is located at the dip of the curve at ~9 cm followed by the oropharynx from ~9 to ~12 cm, the epiglottis (EG) is recorded as the second dip at ~13 cm followed by the hypopharynx from ~13 to ~20 cm and the glottis (GL) between ~20 to ~21 cm (Viviano, 2004). |
MATERIALS AND METHODS
The in vitro test setup consisted of an acoustic pharyngometer (Eccovision, Hood Laboratories, Pembroke, MA, USA), a cast of a human upper airway (oral cavity to the glottis), a 2-m-long vinyl hose (26 mm inner diameter) connected to the glottis as a surrogate for the trachea and the lungs, 2 nasal cavities and a green International Standards Organization connector (Intersurgical Ltd, Wokingham, UK) to connect the “mouth” of the cast to the pharyngometer wavetube.
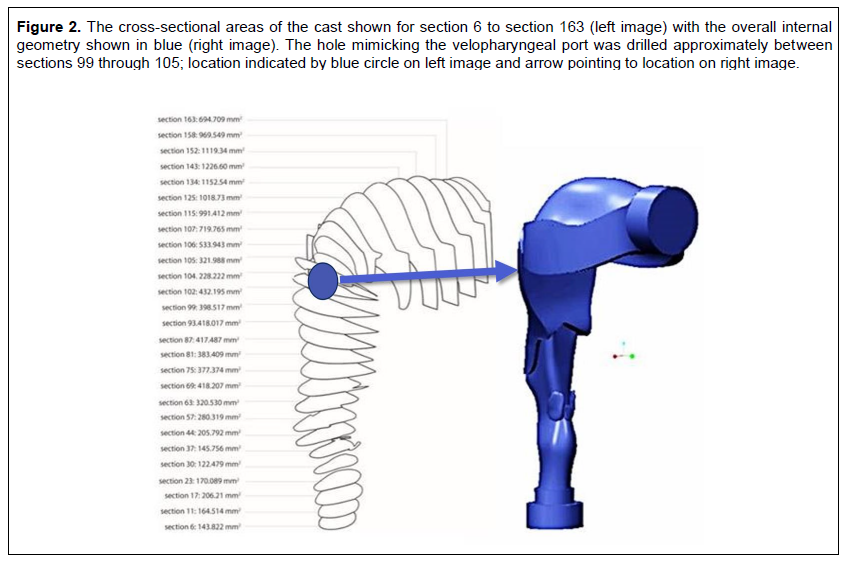
The cast of the human upper airway was a copy of one of the original Swift casts made in resin and constructed from postmortem anatomic casting and reconstruction of the in vivo airways from magnetic resonance imaging (MRI) measurements.14, 15 The cast did not include a velopharyngeal port and the nasal airways. Because the cast was unique, a copy was made by creating a three-dimensional internal geometry (Figure 2, left image). In order to provide a basis for a comparison of the cast geometry with pharyngograms, the internal geometry was divided into 1-mm slices and the cross-sectional area was calculated in mm2 for each slice. Both “ends” of the cast were circular, the mouth with an inner diameter of 29 mm and the glottis with an inner diameter of 24 mm. Based on the internal geometry a new cast was created through stereolithography (Figure 2, right image). The dimensions were: maximal height ~14 cm, maximal width of oral cavity ~7 cm, maximal height of oral cavity ~4.5 cm, length of throat ~12 cm, and length of the “airway” through the middle of the lumen ~20 cm. The internal volume of the cast was ~110 mL when measured filled with water.
In order to mimic an open velopharyngeal port in the cast the approximate position of the velopharyngeal port was identified at ~9 cm from the mouth. A round attachment made of polyvinyl chloride (PVC) with threads was glued to the back of the cast at that position. The attachment was taken from a PVC T-piece (D2466; IPEX, Pineville, North Carolina, USA) so that T-pieces as surrogates for nasal cavities could be fitted to the attachment.
Twelve holes of increasing sizes were drilled through the ~2 mm thick wall of the cast within the attachment in order to mimic different velopharyngeal port sizes. The first hole in the cast was 3 mm in diameter (area 7.1 mm2) and the hole was subsequently enlarged creating 11 incrementally larger circular holes. The 12th and largest hole with a diameter of 14 mm was equal to the inner diameter of the attachment (1.54 cm2), which was close to the sizes of the open velopharyngeal port measured with MRI in healthy subjects.16
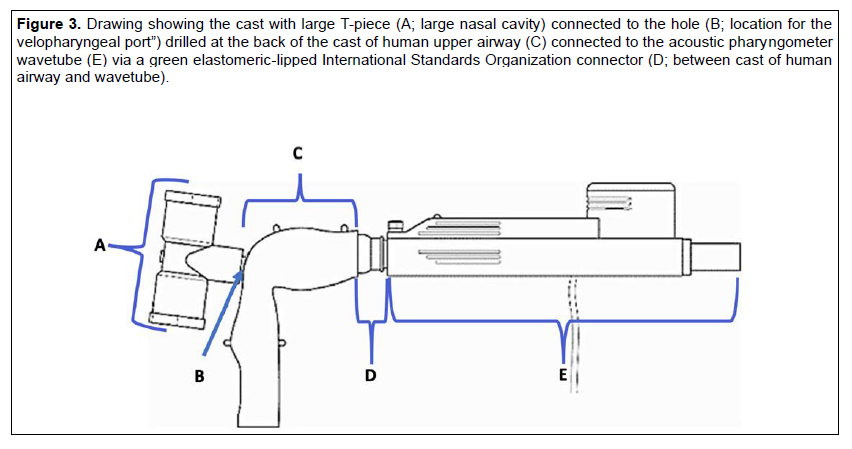
Two PVC T-pieces (IPEX, Pineville, North Carolina, USA) were used in order to create nasal cavities that could be fitted to the attachment at the back of the cast (Figure 3). The large nasal cavity (LNC) had an ~96 mm long T-piece with an outer diameter of ~27 mm and a stem ~20 mm long. The small nasal cavity (SNC) had an ~85 mm long T-piece with an outer diameter of ~18 mm and a stem ~18 mm long. The volumes of the nasal cavities were based on clinical data and were ~20 mL (SNC) and ~30 mL (LNC) measured through water displacement.17
Four baseline pharyngometer recordings were performed with the cast in pristine condition without an open velopharyngeal port. In the following pharyngometer recordings with open velopharyngeal ports, the order of the recordings was per each of the 12 open velopharyngeal port sizes: 4 pharyngometer recordings with an open velopharyngeal port without nasal cavities attached, 4 pharyngometer recordings with the SNC connected to the open velopharyngeal port, and 4 pharyngometer recordings with the LNC connected to the open velopharyngeal port.
Based on the mean baseline recordings the position of two minima (CSA1, CSA2) were determined with CSA1 positioned at 9.73 cm from the mouth, representing the oropharyngeal junction, and CSA2 at 17.02 cm from the mouth representing the epiglottis. In addition to the CSAs, the volume (AUCs) was calculated; AUC1 between the mouth (x = -0.13) and CSA1, representing the oral cavity, AUC2 between CSA1 and CSA2, representing the oropharynx, and AUC3 between CSA2 and end of the cast (x = 20.02), representing the hypopharynx.
The raw acoustic pharyngometry data from each measurement was imported into Microsoft Excel as space-delimited data for the statistical analysis. The effect of the open velopharyngeal port and the nasal cavities on the endpoints was investigated using analysis of variance including an interaction term. The study data were analyzed by SAS 9.2 for Windows (W32_VSPRO platform), running on a Lenovo L412 under Windows 7 Professional. The significance level was established at 0.05.
Figure 2The cross-sectional areas of the cast shown for section 6 to section 163 (left image) with the overall internal geometry shown in blue (right image). The hole mimicking the velopharyngeal port was drilled approximately between sections 99 through 105; location indicated by blue circle on left image and arrow pointing to location on right image. |
Figure 3Drawing showing the cast with large T-piece (A; large nasal cavity) connected to the hole (B; location for the velopharyngeal port”) drilled at the back of the cast of human upper airway (C) connected to the acoustic pharyngometer wavetube (E) via a green elastomeric-lipped International Standards Organization connector (D; between cast of human airway and wavetube). |
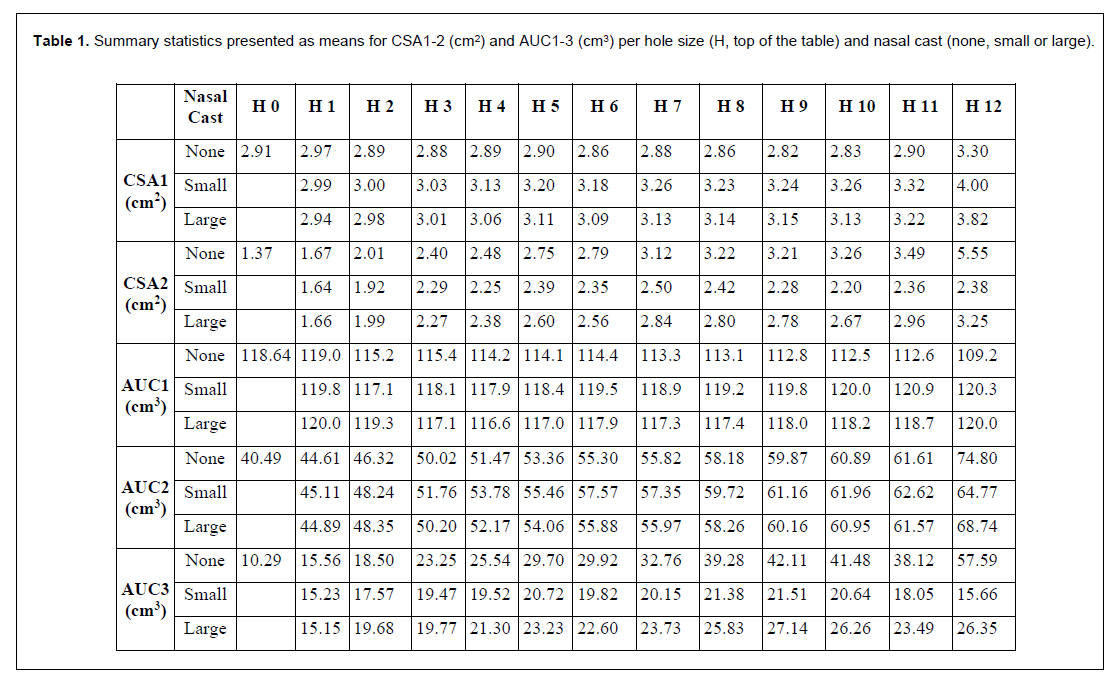
Table 1Summary statistics presented as means for CSA1-2 (cm2) and AUC1-3 (cm3) per hole size (H, top of the table) and nasal cast (none, small or large). |
RESULTS
The mean baseline CSA1 was 2.91 cm2 (standard deviation 0.02) whereas the mean baseline CSA2 was 1.37 cm2 (0.02; Table 1). The matching CSA1 in the cast (Figure 2, left image) could be found in sections 102 through 105 with the minima in section 104 = ~228 mm2 or ~2.3 cm2, whereas the matching CSA2 in the cast could be found in sections 23 through 37 with the minima in section 30 = ~122 mm2 or ~1.2 cm2. The maximal CSAs of the cast and the pharyngograms showed the same type of relationships between, for example, the maximal CSA of the oral cavity of ~1226 mm2 = 12.3 cm2 and the matching baseline pharyngogram CSA of ~12 cm2.
The mean baseline AUC1 was 118.64 cm3, AUC2 40.49 cm3, and AUC3 10.29 cm3, and a total volume of 169.42 cm3 (Table I). The pharyngograms were quite reproducible with a mean standard deviation for CSA1 of 0.01 ranging from 0 to 0.04 (median 0.01) and for CSA2 of 0.01 ranging from 0.01 to 0.07 (median 0.02).
The size of the open velopharyngeal port without a nasal cavity attached had an effect on the mean pharyngograms (Figure 4). The CSAs of the pharyngograms in the area representing the oral cavity (4 to 9 cm; x-axis) decreased from baseline at ~4.5 cm depending on the size of the open velopharyngeal port from ~12 cm2 (baseline) to ~11 cm2 with the largest open velopharyngeal port. Between ~11 cm and ~17 cm a second separation could be seen between the pharyngograms. After ~17 cm the separation between the pharyngograms became more prominent and at 20 cm the pharyngograms followed an almost perfect order in relation to the size of the open velopharyngeal port.
The size of the open velopharyngeal port with the SNC attached had in comparison with the pharyngograms recorded without a nasal cavity less of an effect on the mean pharyngograms (Figure 4). The addition of the SNC minimized the separation of the pharyngograms in the area covering the oral cavity (4 to 9 cm; x-axis). The pharyngogram from the recordings with the largest open velopharyngeal port was somewhat separated from the other pharyngograms at ~8 cm but joined the large bundle of pharyngograms at ~11 cm. There was some further separation of the pharyngograms between ~11 cm and 20 cm but without the order of the pharyngograms seen in the recordings without a nasal cavity attached to the open velopharyngeal port. The pharyngograms recorded with an open velopharyngeal port with the LNC attached resembled those recorded with the SNC attached (Figure 4). The bundle of pharyngograms from ~11 cm onward was somewhat more separated in comparison with pharyngograms from the measurements with the SNC but still lacked the order of the pharyngograms seen in the recordings without a nasal cavity attached.
The changes in the AUCs tended to reflect the changes in the CSAs. For the open velopharyngeal port without a nasal cavity the changes in AUC1 from baseline were all negative, showing the largest change (9.44 cm3) from baseline with the largest size of the open velopharyngeal port (Figure 5). The changes in AUC1 were small when the nasal cavities were attached to the cast. The changes in AUC2 from baseline increased with increasing size of the open velopharyngeal port irrespective of whether a nasal cavity was attached or not (Figure 5). The largest increase occurred without a nasal cast attached to the cast (#12; 34.31 cm3), whereas the changes with the nasal cavities attached were somewhat smaller (SNC 24.28 cm3 and LNC 28.25 cm3). For the open velopharyngeal port without a nasal cavity the changes in AUC3 from baseline were larger than the changes in AUC2, and dependent on the size of the open velopharyngeal port (Figure 5). With the nasal cavities attached to the cast the changes in AUC3 were smaller and resembled the changes seen in AUC2. The largest increases in upper airway volume were with the SNC ~33 mL and with the LNC ~46 mL.
The effect of the size of the open velopharyngeal port was statistically significant for all CSAs (P<0.0001) and AUCs (P<0.0001), whereas the effect of the addition of the nasal cavities was statistically significant only for CSA2 (P<0.0001), AUC2 (P<0.0001), and AUC3 (P<0.0001). The analysis of the interactions indicated that these were statistically significant (P<0.0001) for all CSAs and AUCs.
Figure 4Mean pharyngograms from measurements with an acoustic pharyngometer of a cast with an open velopharyngeal port without a nasal cavity attached (top), with a small nasal cavity attached (middle) and with a large nasal cavity attached (bottom). The 12 different open velopharyngeal port sizes are highlighted in the colors shown in Legend at the bottom. |
Figure 5Changes in AUC1 (top), AUC2 (middle) and AUC3 (bottom) from baseline. The open velopharyngeal port without a nasal cavity attached is shown in blue, the open velopharyngeal port with a small nasal cavity attached in orange and with a large nasal cavity attached in grey. AUC = area under the curve. |
DISCUSSION
The small standard deviations of the mean baseline pharyngograms highlight the repeatability of acoustic pharyngometry when measuring the size of an in vitro upper airway without influences from an open velopharyngeal port, breathing, and swallowing. The baseline pharyngograms resembled pharyngograms recorded in healthy subjects and subjects with OSA in terms of the waveform,3,11,12 but presented only two minima (CSA1, CSA2). The baseline pharyngograms did, however, follow closely the two minimal CSAs in terms of the internal geometry of the cast. In contrast, the pharyngograms did not reflect the three-dimensional internal shape of the cast, instead showing a smooth waveform. Marshall et al reported a similar difference between MRI and a pharyngogram of a subject’s upper airway and pointed out the apparent “smoothing” effect of the acoustic reflection method.10 Possible reasons for the difference between the volume of the cast (~110 mL) and the sum of the baseline AUCs (AUC1-3; 169.42 cm3) include the effect of the connection of the end of the wavetube with the mouth of the cast, the definition of the bottom end of the cast, the properties of the sound-absorbing and reflecting properties of the plastic cast,9 and the “smoothing” effect described by Marshall et al.10
The introduction of acoustic leaks through an open velopharyngeal port created clear variations in the pharyngograms as compared to the baseline pharyngograms. The largest increases in the epiglottis (CSA2) and the hypopharynx (AUC3) from the baseline values without a nasal cavity attached occurred between the epiglottis and the glottis. The addition of the nasal cavities to the open velopharyngeal port reduced the increases in the pharyngograms seen without the addition of the nasal cavities especially for the hypopharynx. The size of the open velopharyngeal port had an effect on the sizes of the CSAs and the AUCs – both negative and positive – and was more prominent than the volumes of the nasal cavities. The reason for the differences in the open velopharyngeal port effect when measured without and with nasal cavities is difficult to explain because there is no guidance in published studies. However, the data suggest that the smaller the nasopharyngeal acoustic leak, the smaller the increase in volume distal to the nasopharyngeal acoustic leak.
Possible causes of an in vivo open velopharyngeal port during acoustic pharyngometry include nose breathing10 and alteration of mandibular position.18,19 Nose breathing can be prevented with the use of nose clips; however, an open velopharyngeal port caused by alteration of mandibular position is not easily identified nor prevented. The addition of nasal cavities to the velopharyngeal port in the current in vitro study mimicked the function of nose clips as the nasal cavities added a closed volume to the velopharyngeal port. Addition of the nasal cavities somewhat reduced the increases in the pharyngograms from those documented without the addition of the nasal cavities. These findings suggest that the use of nose clips could be relevant in clinical practice for reducing but not eliminating the effect of an open velopharyngeal port. However, the in vitro results do not present any solution on how to avoid an open velopharyngeal port created by an increase in velopharyngeal patency 18, 19 that is associated with altering mandibular position during acoustic pharyngometry. It is therefore difficult to make any specific suggestions on how to manage the effect of an acoustic leak that results from an increase in velopharyngeal patency on the pharyngogram in clinical practice. This in vitro study suggests that the inadvertent addition of nasal cavity volumes, of indeterminate size, to the oral airway volumes is a critically important phenomenon that has the potential to led to incorrect clinical decisions. Thus, an increase in the pharyngogram volume following horizontal or vertical changes in the mandibular position should be reviewed with caution.
At habitual baseline mandibular position, measurement of the upper airways through acoustic pharyngometry compare favorably to those obtained through MRI.10 The authors are, however, not aware of any attempt to validate acoustic pharyngometry measurements at other than habitual baseline mandibular position, where the resulting nasopharyngeal acoustic leak may influence the measurements. A recently published comparison of acoustic reflection and cone beam computed tomography (CBCT)-derived measurements of the upper airways demonstrated a statistically significant positive correlation,20 which has also been documented by others comparing acoustic pharyngometry and CBCT.21 However, as pointed out, the Pearson correlation coefficient showed medium strength for both area and volume measurements, indicating that the two methods were not correlated.20 Notwithstanding the statistically significant positive correlation, it was concluded that “the two methods are not interchangeable. Therefore, the pharyngometer is not a valid tool to replace the CBCT for airway measurements.” The in vitro findings in the current study suggest that acoustic pharyngometry measurements seem to be sensitive to a nasopharyngeal acoustic leak, whereas there is no reason to believe that CBCT measurements are. Hence, a nasopharyngeal acoustic leak might be behind the difference between the acoustic pharyngometry and CBCT results documented in the aforementioned study.
The risk of an open velopharyngeal port during acoustic pharyngometry has recently been highlighted by Zaremba et al, who wrote: “To prevent nasal leakage due to opening of the velum, the study subjects were instructed to breathe through their mouth only, and a nose clip was applied”.22 However, no information was provided regarding how the authors excluded pharyngograms that deviated from the majority of pharyngograms. In order to identify outlier pharyngograms, the individual pharyngograms within each set of four pharyngograms could be compared to the median pharyngogram by calculating a goodness-of-fit measure. Goodness of fit would be defined as the square root of the average squared vertical distance between the median pharyngogram and the pharyngogram under study. The region over which the goodness-of-fit calculation would be performed would be limited to the region from the wavetube to the glottis. The limit at which pharyngograms would be excluded from further calculations would then be set. An algorithm based on a goodness-of-fit calculation with a defined deviation limit would facilitate a more standardized classification of pharyngograms.
The in vitro study design has a number of potential limitations. The cast model was made of a plastic material that might have an acoustic reflection and penetration that probably differs from other plastics, glass, or metal. However, as the baseline pharyngograms closely followed the two minimal CSAs of the internal geometry of the cast, it is unlikely that the plastic used had an effect on the pharyngograms. Only one design of nasal cavity was tested and the pharyngograms might have been different in shape and size with a more anatomically correct nasal cavity.
CONCLUSION
The results of the current in vitro study have several implications. First, the study did confirm the study hypothesis regarding the consequences of an acoustic leak through an open velopharyngeal port, which might create an overestimation of the volume of the upper airways as displayed on the pharyngogram. Because of the sizes of the open velopharyngeal ports tested it is obvious that even small acoustic leaks might have an effect on the pharyngogram. The main effect of the open velopharyngeal ports seems to occur after the position of the acoustic leak on the pharyngogram. The challenge in clinical practice will be to verify when an acoustic leak occurs and to eliminate it, and to identify other maneuvers that might lead to a nasopharyngeal acoustic leak. The goodness-of-fit measure was discussed as a possible solution. When interest in the use of acoustic pharyngometry in the practice of dental sleep medicine is considered, which involves taking acoustic measurements after altering mandibular position, the results of the current study suggest that accurate clinical assessment of the effect that mandibular repositioning has on the upper airway volume and CSAs will not be possible unless it can be ascertained that the data have not been tainted by a nasopharyngeal acoustic leak.
ABBREVIATIONS
CSA: cross-sectional area
AUC: area under the curve
MRI: magnetic resonance imaging
PVC: polyvinyl chloride
ISO: International Standards Organization
LNC: Large Nasal Cavity
SNC: small nasal cavity
CBCT: cone beam computed tomography
REFERENCES
- Fredberg JJ, Wohl, ME, Glass GM, Dorkin HL. Airway area by acoustic reflections measured at the mouth. J Appl Physiol Respir Environ Exerc Physiol. 1980;48(5):749-758.
- Hoffstein V, Fredberg JJ. The acoustic reflection technique for non-invasive assessment of upper airway area. Eur Respir J. 1991;4(5):602-611.
- Viviano JS. Acoustic reflection: Review and clinical applications for sleep- disordered breathing. Sleep Breath. 2002;6(3):129-149.
- Viviano JS. Airway orthotics: Normalizing the pathological airway. Sleep Review. 2002;3(1):1-4.
- Viviano JS. Assessing orthotic normalization of pharyngeal dynamics. Cranio. 2004;22(3):192-208.
- Rubinstein I, McClean PA, Boucher R, Zamel N, Fredberg JJ, Hoffstein V. Effect of mouthpiece, noseclips, and head position on airway area measured by acoustic reflections. J Appl Physiol. 1987; 63(4):1469-1474.
- Molfino N, Zamel N, Hoffstein V, Fredberg JJ. Artifacts in measuring airway areas by acoustic reflections. Am Rev Respir Dis. 1990;142(6 Pt 1):1465-1466.
- Guilmette RA, Cheng YS, Griffith WC. Characterising the variability in adult human nasal airway dimensions. Ann Occup Hyg. 1997;41(1):491-496.
- Hilberg O, Jensen FT, Pedersen OF. Nasal airway geometry: comparison between acoustic reflections and magnetic resonance scanning. J Appl Physiol. 1993;75(6): 2811-2819.
- Marshall I, Maran NJ, Martin S, et al. Acoustic reflectometry for airway measurements in man: implementation and validation. Physiol Meas. 1993;14(2):157- 169.
- Kamal I. Acoustic pharyngometry patterns of snoring and obstructive sleep apnea patients. Otolaryngol Head Neck Surg. 2004;130(1):58-66.
- Kamal I. Test-retest validity of acoustic pharyngometry measurements. Otolaryngol Head Neck Surg. 2004;130(2):223-228.
- Cheng YS, Yamada Y, Yeh HC, Swift DL. Deposition of ultrafine aerosols in a human oral cast. Aerosol Sci Technol. 1990;12:1075-1081.
- Swift DL. Inspiratory inertial deposition of aerosols in human nasal airway replicate casts: implication for the proposed NCRP lung model. Rad Prot Dosim. 1991;38:29-34.
- Swift DL, Cheng YS, Su YF, Yeh HC. Ultrafine aerosol deposition in the human nasal and oral passages. Ann Occup Hyg. 1994;38(1):77-81.
- Demolin D, Delvaux V, Metens T, Soquet A. Determination of velum opening for French nasal vowels by magnetic resonance imaging. J Voice. 2003;17(4):454-467.
- Mishima H, Kase Y, Hiraiwa F, Linuma T. The influence of septal perforation on measurement by acoustic rhinometry. Nihon Jibiinkoka Gakkai Kaiho. 2001;104(8):815-823. doi: 10.3950/jibiinkoka.104.815.
- Isono S, Tanaka A, Sho Y, Konno A, Nishino T. Advancement of the mandible improves velopharyngeal airway patency. J Appl Physiol. 1995;79(6):P2132-2138.
- Chan ASL, Sutherland K, Schwab RJ, et al. The effect of mandibular advancement on upper airway structure in obstructive sleep apnoea. Thorax. 2010;65:726e732. doi:10.1136/thx.2009.131094
- Ananthan S, Patel S, Sofferman B, Korczeniewska OA, Creanga A. Is the acoustic pharyngometer a valid tool for airway assessment?. J Dent Sleep Med. 2021;8(1).
- Tsolakis IA, Venkat D, Hans MG, Alonso A, Palomo JM. When static meets dynamic: Comparing cone-beam computed tomography and acoustic reflection for upper airway analysis. Am J Orthod Dentofacial Orthop. 2016;150(4):643-650.
- Zaremba S, Mueller N, Heisig AN, et al. Elevated upper body position improves pregnancy-related OSA without impairing sleep quality or sleep architecture early after delivery. Chest. 2015;148(4):936- 944.
SUBMISSION & CORRESPONDENCE INFORMATION
Submitted February 16, 2021
Submitted in final revised form June 14, 2021
Accepted for publication July 15, 2021
Address correspondence to: John Viviano, DDS, Sleep Disorders Dentistry Research and Learning Center, 5045 Orbitor Drive STE 10-300, Mississauga, Ontario Canada L4W 4Y4; Phone: 416 500 2901; Email: John@DrViviano.com