Original Article 2, Issue 7.2
Three-Dimensional Changes in Skeletal/ Dental Landmarks With Use of Mandibular Advancement Device
http://dx.doi.org/10.15331/jdsm.7120
Da In Kim, Manuel Lagravère Vich, DDS, MS, PhD, Pedro Mayoral, DDS, MS, PhD, Manuel Miguez, DDS, MS, PhD
University of Alberta
ABSTRACT
Study Objectives:
The mandibular advancement device (MAD) is a treatment option for obstructive sleep apnea (OSA). The goal is to analyze and determine changes in the position of dental and skeletal structures between cone beam computed tomography (CBCT) images obtained from patients currently using the MAD as a treatment modality for OSA.
Materials and Methods:
Eighteen patients underwent CBCTs for MAD treatment. Landmarks were placed in different structures and distances/angles were calculated. Reliability was done measuring CBCT images of five patients three times. Descriptive statistics, repeated-measures analysis of variance, and paired t-test were used.
Results:
Landmarks presented excellent reliability, the lowest being the z-axis of the rightmost anterior-superior part of the coronoid process (intraclass correlation coefficient = 0.854). The largest mean change in distance was from the buccal furcation of 17 to 47 (-6.66+/--6.66mm). The largest mean change in angle was 27 buccal furcation-left lingula-left hyoid bone (-16.83+/- 27.30°). There is a mean distance change of 0.55 mm and a mean angular change of 13.11° of all linear distances and angles assessed.
Conclusions:
Vertical linear skeletal changes with placement of a MAD include a vertical increase of the mandible relative to the maxilla and a superior movement of hyoid bone relative to the mandible. AP linear changes include mandibular protrusion and anterior movement of the hyoid bone relative to the cervical vertebrae, and an anterior movement of the hyoid bone relative to the maxilla. Angular movements include the rotation of the hyoid bone anterosuperiorly. Skeletal repositionings should be correlated with patient symptoms to determine whether short- or long-term usage of the MAD is indicated for patients. Assessing specific tendencies with the use of the MAD will help clinicians to also predict outcomes of skeletal changes to ultimately decide the best candidates for this type of treatment.
Keywords:
Mandibular Advancement Device, Cone-Beam Computed Tomography, Airway
Citation:
Kim DI, Lagravère Vich M, Mayoral, P, Miguez M. Three-Dimensional Changes in Skeletal/ Dental Landmarks With Use of Mandibular Advancement Devices. J Dent Sleep Med. 2020;7(2)
INTRODUCTION
Obstructive sleep apnea (OSA) is a common, chronic, and progressive breathing problem with an estimated prevalence of 3% to 17% in the adult population.1 Because of inspirational collapse of the upper airway during sleep as well as other anatomic reasons, the airway for breathing is either temporarily inhibited or reduced, causing hypoxemia.1 This overall breathing problem at nighttime leads to daytime loss of quality of life, as common symptoms related to OSA includes excessive daytime sleepiness, reduced memory, and systemic hypertension.2, 3
Although continuous positive airway pressure is a common standard treatment, many clinicians report patient intolerance of these bulky, cumbersome machines and thus poor patient compliance.4 This poor tolerability5 and poor compliance may outweigh the treatment benefit for certain patients. Recent studies and systematic reviews6,7 indicated that up to 50% of patients can be effectively treated by using a mandibular advancement device (MAD). A MAD may be indicated in select patients; it is a removable dental splint that helps protrude the mandible forward while the patient is lying down in order to enlarge the upper airway and prevent inspirational collapse. Recent studies have shown the protruding effect of the mandible to stretch the pharyngeal soft tissues to ultimately reduce upper airway collapse and symptoms of OSA.8 This evidence is strong for short-term and potential long-term management of OSA with oral appliances considering the associated positive effects on the soft-tissue structural changes. However, assessing soft tissue alone is not promising when attempting to determine the potential changes the MAD has on the patient’s airway. One of the limitations is that soft-tissue landmarks of the pharyngeal airway are not very precise and therefore can cause analysis bias.9 Therefore, in addition to any changes in the soft tissues, it is essential to determine the skeletal and dental changes in patients with and without the use of a MAD. By doing so, this will help clinicians predict whether using this device will be clinically appropriate and safe for patients, as well as determining the correct patient pool for using this treatment modality over other treatment options. MADs influence the posture of the mandible, hyoid bone, head, and neck,10,11 and thus determining tendencies in structural changes to the craniofacial area will give the clinicians an important physiologic basis when starting MAD therapy. Additionally, determining the amount of change of the hard tissues will give clinicians certain expectations regarding the amount and extent of changes when using MAD on patients. The objective of this study is therefore to analyze and determine any changes in the position of dental and skeletal structures between CBCT images obtained in patients currently using the MAD as a treatment modality for their OSA.
MATERIALS AND METHODS
Cone beam computed tomography (CBCT) from 18 patients that were seen at the University of Alfonso X Madrid graduate orthodontic clinic were selected for analysis. The subjects included were in the age range of 29 to 63 years, with an average age of 67 years. One female and 17 male patients were selected. The basis for the sample size of 18 participants was based on the availability of the images needed for the purpose of this study, because images were selected retrospectively among a main database of patients. CBCT scans of 0.3-mm voxel size were taken with the Carestream CS 9300 Select, Rochester, New York, USA, exposition 80Kv 4mA 8.01s, dose 448mGy cm2, size 18 µm ×18 µm ×18 µm, image 10 cm ×10 cm ×10 cm according to manufacturer’s settings.
For each patient, two CBCT images were taken with an average of 6 months between each of the CBCTs: one at the diagnosis appointment, and another during the treatment phase with the MAD in place. The initial advancement given was 7 to 8 mm, and if necessary, more advancement was given to the patients. The final advancement given to all 18 patients was in the range of 7 to 8 mm. This totals 36 CBCT images analyzed for the purposes of this project. All CBCT images were chosen with patients in their natural upright head positions, with the Frankfort plane parallel to the floor. No protocol was in place to control swallowing and breathing. As all data were collected retrospectively, exacting positioning of the head was not able to be controlled. CBCTs were then analyzed using a third-party software AVIZO (Thermo Fischer Scientific, Hillsboro, Oregon, USA), which showed the three-dimensional reconstruction of the image for landmark positioning.
The MAD used was the NOA by OrthoApnea (Málaga, Spain). A George gauge with a thickness of 2 mm (measured from the border of the upper incisors to the lower incisors; vertical interincisal) was used to measure maximum retrusion and protrusion with 5-mm vertical increase between upper and lower incisal edges. The initial amount of advancement of 60% to 70% of maximum protrusion, was measured with a George gauge, and was determined based on the individual tolerability of the patients. Ultimately, protrusive advancements between 7 to 8 mm was given for all 18 patients.
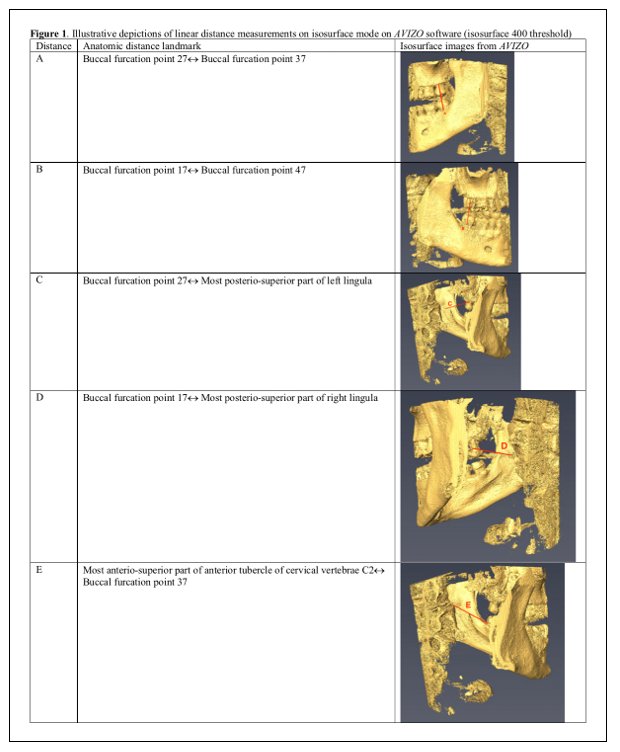
In relation to a reference point, each CBCT landmark (Figures 1 and 2) was given coordinates in x, y, z format. The reference points for these three coordinates were placed arbitrarily among the coordinates of the software program, because the emphasis was placed on the distance between two points, not a specific reference point.
The euclidean distance formula was used to determine 24 linear distances for corresponding x, y, z coordinates: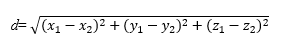
The cosine formula was used to determine seven angles for corresponding x, y, z coordinates. The angles were based off a three-sided triangle scheme of three specific landmarks each: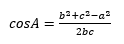
For reliability analysis, five CBCTs from the main sample were selected. These samples consisted of two MAD images and three diagnosis stage (Dx) images. This was performed by initially obtaining 24 preselected landmarks. Each landmark was marked three times each for each CBCT image. A time span of 3 days took place after each of the three trials in order to minimize any errors regarding the researcher’s subjectivity of the placement of certain landmarks on the CBCT, especially those landmarks that were hard to locate on the CBCT. All images were analyzed by the same investigator. Finally, coordinates of the CBCT were analyzed for reliability calculations.
Following landmark reliability calculations, the true dataset of specific distances and angles were obtained for each of the 36 CBCT images and were analyzed. Descriptive statistics analysis of variance and paired t-test calculations were applied in order to obtain information about the difference in distances or angles between the CBCT images taken at the diagnosis phase or the post-MAD phase. CBCT has a high precision (1:1 image to reality ratio), minimum deviation, and is highly reliable when evaluating linear and angular measurements for craniofacial analysis.12-18
RESULTS
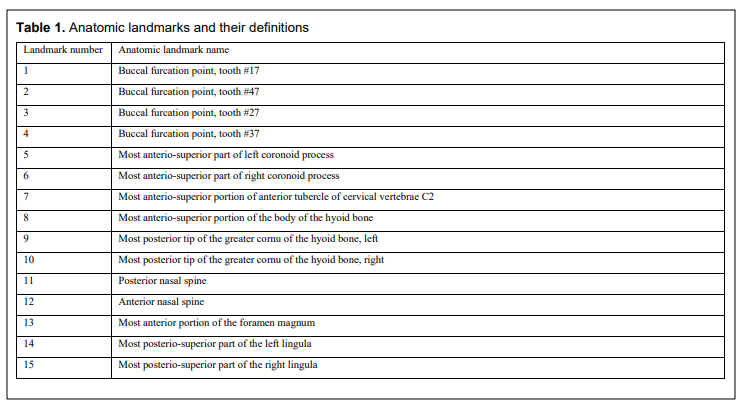
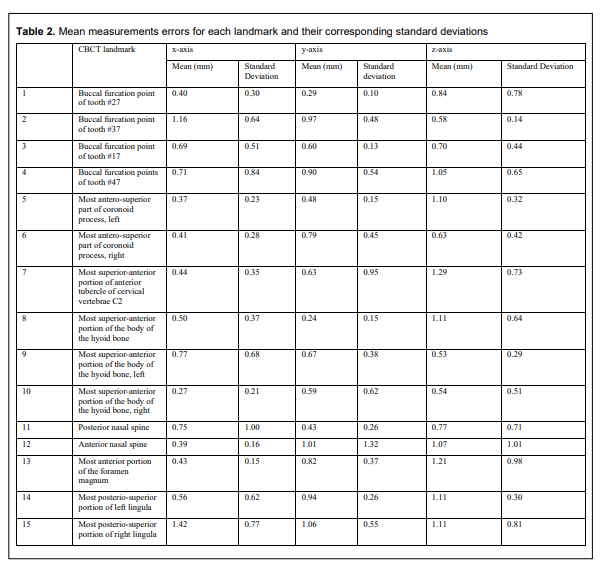
All landmarks (Table 1) presented excellent reliability with the lowest being the z-axis of the rightmost anterior-superior part of the coronoid process with an intraclass correlation coefficient of 0.854. The highest mean measurement error of the landmarks was 1.64 mm at the x-axis. No standard deviation was reported for this mean measurement error (Table 2).
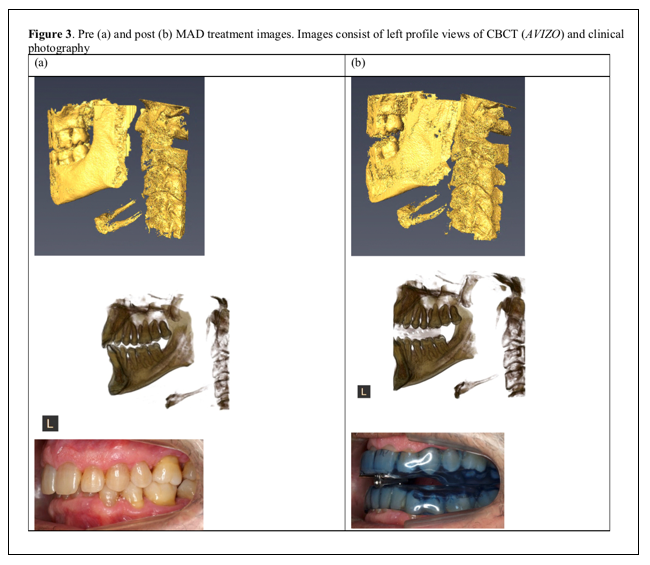
When comparing the difference between Dx and postimaging with the MAD (Figure 3), the largest mean change in distance was from the buccal furcation of 16 to 46 (6.66 ± 4.72 mm) (Tables 3 and 4). When comparing the difference between MAD-Dx (mandibular advancement device to diagnosis stage) distance measurements via the paired t-test, all data except the following were statistically significant (P<0.05): buccal furcation point tooth #16 to buccal furcation point tooth #46, cervical vertebrae C2 to body of hyoid bone. Although the value of P of the C2 to body of hyoid bone distance was deemed insignificant, a very small MAD-Dx mean difference of 1.24 mm with a standard deviation of 4.32 mm makes this measurement comparable. The largest mean distance difference between MAD-Dx treatment images was 6.66 mm with a standard deviation of 4.72 mm for the distance between the buccal furcation point tooth #16 to buccal furcation point tooth #46. Most mean distance differences between the MAD-Dx images were less than 2.0 mm. Such small means indicates that the distances of the landmarks measured with either the diagnosis or MAD images are very similar and thus comparable. Some mean distance measurements contain negative values for the MAD-Dx, indicating that the distance after the MAD actually shortened. However, whether the MAD-Dx value was positive or negative, paired measurements of left and right sides had similar means. This indicates that these measurements are comparable.
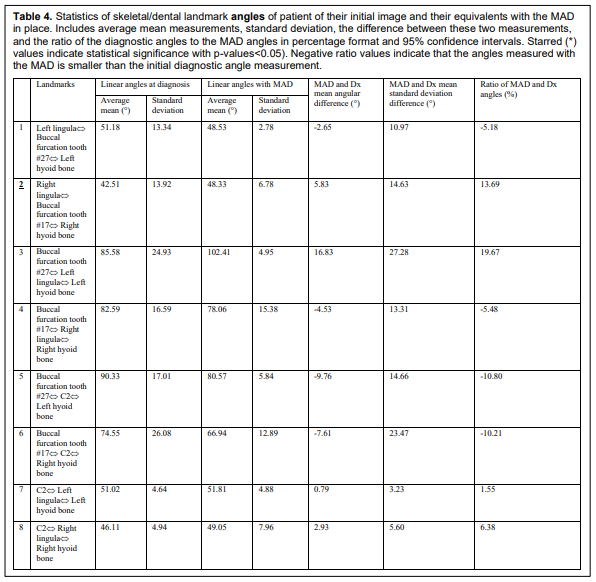
The largest mean change in angle was 27 buccal furcation-left lingula-left hyoid bone (16.83± 27.28). All data except the angle between right lingula- buccal furcation tooth #17- right hyoid bone was statistically significant (P<0.05). The mean difference of this angle was 5.83° with a standard deviation of 14.63°. This relatively small mean angular difference makes this measurement comparable. Most mean angular differences between MAD-Dx images were less than 17.0°, making all angles used very comparable.
DISCUSSION
A MAD is an effective treatment option 4,5, 19, 20 for select patients with OSA, but skeletal and dental changes that may be caused by the device is a concern to clinicians. By better understanding specific trends in skeletal changes, clinicians will be able to make the most informed decisions when choosing the correct patient pool for using this treatment modality. Dividing landmarks into linear and angular changes will make the analysis of any potential changes more feasible.
Linear Distance Measurements
In the current study, all linear distance measurements show standard deviations between 2.53 mm (buccal furcation 17 to buccal furcation 47, MAD) to 14.97 mm (superoanterior C2 anterior tubercle to buccal furcation 47, MAD). These relatively small standard deviations show that over a large sample size, the measurements obtained are very similar and less variable. The average landmark distance of all patients with the largest pair of standard deviation measurements was the distance of the superoanterior C2 tubercle to the buccal furcation of 47 (13.97 mm, Dx and 14.97 mm, MAD) shows that there is a lot of variation between the anterior tubercle landmark to the 47 buccal furcation landmarks in both the MAD and Dx positions.
The ratio between the MAD and Dx measurements indicates their close correlation and any amount of variation of difference between them. The ratio percentages of linear distances presented in Table 3 indicate the percentage of the Dx distance measurements compared to that of the MAD measurements. The percent increase ratios after the placement of the MAD are all mostly within ±6.2%. The linear distances measured can be broken down to measurements in the vertical and anteroposterior (AP) dimensions.
With regard to linear vertical dimensional changes, the ratio between the MAD and Dx measurements range from 0.10% (buccal furcation 17 to right greater cornu of hyoid bone, posterior tip) to -5.99% (buccal furcation 47 to right greater cornu of hyoid bone, posterior tip). Three significant linear vertical dimensional changes are found:
The first change is the vertical increase in height of the mandible relative to the maxilla. This tendency is described by four measurements listed below (Table 3):
- Buccal furcation 27 ⇔ Buccal furcation 37
- Buccal furcation 17 ⇔ Buccal furcation 47
- Buccal furcation 17 ⇔ Posterosuperior right lingula
- Buccal furcation 27 ⇔ Posterosuperior left lingula
The second change is the vertical increase in height of the mandible relative to the superoanterior C2 anterior tubercle. This tendency is described by the two measurements listed below (Table 3):
- Superoanterior C2 anterior tubercle ⇔ Buccal furcation 37
- Superoanterior C2 anterior tubercle ⇔ Buccal furcation 47
The third vertical linear distance change is the superior movement of the hyoid bone relative to the maxilla, as can be described by the following two measurements:
- Buccal furcation 17 ⇔ Right greater cornu of hyoid bone, posterior tip
- Buccal furcation 27 ⇔ Left greater cornu of hyoid bone, posterior tip
The fourth vertical linear distance change is the superior movement of the hyoid bone relative to the mandible, as can be described by the following eight measurements:
- Superoanterior body of hyoid bone body ⇔ Posterosuperior left lingula
- Superoanterior body of hyoid bone body ⇔ Posterosuperior right lingula
- Left greater cornu of hyoid bone posterior tip ⇔ Posterosuperior left lingula
- Right greater cornu of hyoid bone posterior tip ⇔ Posterosuperior right lingula
- Posterosuperior left lingula ⇔ Left greater cornu of hyoid bone, posterior tip
- Posterosuperior right lingula ⇔ Right greater cornu of hyoid bone, posterior tip
- Buccal furcation 37 ⇔ Left greater cornu of hyoid bone, posterior tip
- Buccal furcation 47 ⇔ Right greater cornu of hyoid bone, posterior tip
With regard to AP linear dimensional changes, the ratio between the MAD and Dx measurements range between 0.30% (superoanterior C2 anterior tubercle to buccal furcation 27) to 6.19% (superoanterior C2 anterior tubercle to buccal furcation 47). The largest percent ratio changes in the AP dimension (6.19%, 3.27%) are found with distances that include mandibular molar buccal furcations as a landmark. These can be considered clinically insignificant, as the MAD advanced the mandible at an average of 7 to 8 mm; thus, we would expect with ratio to be larger. Otherwise, three significant AP linear distances changes are noted.
The first AP distance change is the mandibular protrusion relative to the cervical vertebrae, as described by the four linear distances below (Table 3):
- Superoanterior C2 anterior tubercle ⇔ Buccal furcation 47
- Superoanterior C2 anterior tubercle ⇔ Buccal furcation 37
- Superoanterior C2 anterior tubercle ⇔ Posterosuperior left lingula
- Superoanterior C2 anterior tubercle ⇔ Posterosuperior right lingula
The second AP distance change is the anterior hyoid bone movement relative to the cervical vertebrae, as described by the three linear distances below (Table 3):
- Superoanterior C2 ⇔ Left hyoid bone
- Superoanterior C2 ⇔ Right hyoid bone
- Superoanterior C2 ⇔ Body of hyoid bone
Similarly, the third AP distance change is the anterior hyoid bone movement relative to the maxilla, as described by the two linear distance below:
- Buccal furcation 27 ⇔ Left greater cornu of hyoid bone, posterior tip
- Buccal furcation 17 ⇔ Right greater cornu of hyoid bone, posterior tip
Overall, there is a tendency for having less similarity between bilateral linear distances along landmarks near the extremity of the CBCT field of view. These extremity landmarks include the C2 spinal landmark and any of those along the hyoid bone. This variability may be attributed to the increased unclarity of the CBCT slices particularly in these areas. Naji et al.28 found a similar finding with CBCT slices, that some skeletal, curvy, pointed structures can become flat in different CBCT slices, making it hard to define as a single point. Additionally, Naji et al.28 identified that one of the challenges when attempting to landmark the left and right posterior hyoid bone was that this landmark can be missed in some scans, not being included in the field of view.
The devices were made with a protrusion of 7 to 8 mm measured using a George gauge at 2 mm of increased vertical inter-incisor distance and with a total vertical increase of 5 to 8 mm (2 mm plus overjet). The results of this study show a significant increase in vertical position of the mandible relative to the maxilla as expected and less significant increase in anterior displacement relative to C2 than what would be expected. This can be because the first CBCT was taken in normal occlusion and the second with the vertical and anterior displacement mentioned. As described by Mayoral et al.,29 an increase in vertical distance retrudes the mandible by the posterior rotation of the mandible, thus, placing the mandible in a more retruded position (0.3 mm for every 1 mm of vertical increase up to 8 mm of interincisal distance). As the bite was opened, nearly 5 to 8 mm, the mandible rotated posteriorly and therefore started the protrusion from a more posterior position than in normal occlusion. Additionally, even if the interincisal distance increases by 5 to 8 mm, it is expected that reference points located more posteriorly to this reference point, such as the molar furcations used in this study, will have a vertical increase that is less than the interincisal distance. The AP displacement of the mandible relative to the C2 reference point is also measured in a diagonal line, and thus any protrusive movements with the MAD will result in a numeric distance displacement of a lesser degree than what physically takes place. This can explain the result of only 1.98 mm AP increase relative to the cervical vertebra even though the advance given was 7 to 8 mm.
Overall, the MAD and Dx mean standard deviation differences of linear distances range between 1.47mm (superoanterior C2 anterior tubercle⇔ posterosuperior left lingula) to 6.45 mm (buccal furcation 27⇔buccal furcation 37). The variation in such standard deviations do not show a specific pattern relative to any particular landmark used in the study. Any higher or lower standard deviation between two similar points indicate one of the limitations to this study, which was a high amount of noise and artifacts within the CBCT, making specific landmarking of reference points difficult in terms of placement. Although the reliability was high for landmarking, the high accuracy of each individual reference point may have served as a limitation, leading to varying standard deviations between similar linear distances.
Angular Measurement
In the current study, all selected angles measure potential AP changes between landmarks. All angular measurements show a standard deviation between 2.78% (left lingula to buccal furcation 27 to left hyoid bone, MAD) to 26.08% (buccal furcation 17 to C2 to right hyoid bone, Dx). Angles with relatively large standard deviations show that there is a lot of variation between the landmarks in their corresponding positions. The percent ratio of MAD to Dx angles ranges from 1.55% (C2 to left lingula to left hyoid bone) to 19.67% (buccal furcation 27 to left lingula to left hyoid bone).The first angular change that is noted is the tendency for the hyoid bone to rotate anterosuperiorly with placement of the MAD, as can be seen with the following angles (Table 4):
- Buccal furcation tooth #27 ⇔ C2⇔ Left hyoid bone
- Buccal furcation tooth #17 ⇔ C2⇔ Right hyoid bone
The second angular change that is noted is the tendency for the hyoid bone to rotate anterosuperiorly at a relatively larger angular dimension compared to the mandible. This can be seen with the following angles (Table 4):
- C2⇔ Left lingula⇔ Left hyoid bone
- C2⇔ Right lingula⇔ Right hyoid bone
With regard to angular movements of the mandible and its relation to the hyoid bone, inconsistent findings are seen, as can be found in the following angular measurements (Table 4):
- Left lingula⇔ Buccal furcation tooth #27⇔ Left hyoid bone
- Right lingula⇔ Buccal furcation tooth #17⇔ Right hyoid bone
- Buccal furcation tooth #27⇔ Left lingula⇔ Left hyoid bone
- Buccal furcation tooth #17⇔ Right lingula⇔ Right hyoid bone
Such angles do not show equal bilateral changes in degrees. This tendency of having less similarity between bilateral angles may be attributed to the fact that there is large bilateral variability of the movement of the hyoid bone. Battagel et al.23 also found that the hyoid bone moves with extreme intersubject variability, both in amount and direction. This finding is augmented in the above four measurements when landmarks for both the hyoid and the mandible are taken into consideration when determining angular degrees. Another potential reason why there is extreme bilateral discrepancy of these landmarks may be because landmarks near the extremities of the CBCT such as the hyoid bone and the C2 spinal level landmarks were missed in some scans and were not included in the field of view, which may ultimately lead to inaccurate landmarks. This may also be the reason why standard deviations of angular measurements are relatively larger compared to linear distances, because many of the selected angles have at least one landmark that is considered to be within the extreme limits of the CBCT field of view.
Clinical significance of these skeletal and dental findings, both linear and angular, may only be assessed based on additional analysis of soft-tissue changes as well as patient reports and clinical analysis of ameliorating symptoms of OSA. Tendencies of bony changes found with MAD usage can be used to extrapolate potential soft- tissue changes and their effects on the airway. MAD could enlarge the pharyngeal airway by anterior displacements of the hyoid bone and its muscular attachments. It could also enlarge by lifting the epiglottis away from the posterior pharyngeal wall, thereby reversing the narrowing of the laryngeal inlet.
The hyoid bone serves as the main anchorage bone for muscles of the tongue and determines its position within the oral cavity.32 Pharyngeal muscle repositioning and soft-tissue changes in conjunction with these skeletal changes of the mandible and hyoid bone may enlarge the pharynx and cause positive changes to the airway movement.34 However, more studies including the effect of soft tissues to skeletal repositioning and patient symptoms must be considered to determine any clinical correlations.
Specific initial characteristics of a patient may serve as a confounding factor for these results; thus, cephalometric analysis was conducted to determine the SNA (sella-nasion-A point). SNB (sella-nasion-B point). ANB (A point, nasion, B-point), Y-axis, and SN-MPI (sella-nasion to mandibular plane angle) for these patients without the MAD. All distances and angles resulted in the same outcomes: All patients had an average position of the maxilla with respect to the cranial base, an average position of the mandible with respect to the cranial base, and a class I relationship. SN-MPI values showed that all distances and angles averaged up to an average extent of vertical growth of the face. Y-axis values indicated that all distances and angles resulted in a hyperdivergent growth pattern. Overall, the initial mean skeletal characteristics of all patients were identical. Thus, it can be concluded that the overall effects of the MAD as observed were not influenced by the initial skeletal and dental characteristics of the sample. Similar findings of both linear and angular distances are found when comparing results obtained from lateral cephalometric studies. Kim et al.35 published a study to evaluate clinical outcomes of MAD to estimate its influencing factors for the treatment of OSA. In their studies, the hyoid-ANS angulation was increased to values ranging between 79.59 ± 8.87°, indicating a larger change in angulation between the hyoid bone and the maxilla. They additionally found that the hyoid-gonion angle was decreased to a range of 25.54 ± 6.28°, indicating the closer approach of the hyoid bone toward the mandibular gonion. This is very similar to the findings of this study, where it was observed that the hyoid bone moves superiorly when protruding with use of MAD. Additionally, Sakamoto et al.36 also found a similar finding from their lateral cephalogram study that oral appliances pull the mandible forward to increase the activity of the geniohyoid muscle, ultimately bringing these two anatomic landmarks closer to each other.
Because there are limitations to this study, changes could be made to improve the design. Due to the data being collected retrospectively, there was no method for more strict control of head positions for the CBCT: patients were advised to keep the head in the natural position with the Frankfurt plane parallel to the floor. The result of minor changes in head positions may lead to minor errors in landmark positioning and thus errors in angular and distance measurements, especially in mobile areas such as landmarks on the mandible. It is possible that different results would have been obtained with the neck in flexion and upper cervical extension.
Because this study was based on retrospective patient data, this leads to a limited sample size. A higher sample size is needed based on a priori calculations, but such calculations were not performed for the current study, because there were only a few patient files within the database that included both the Dx and MAD CBCT images.
Another limitation to this study was the limitations of the small field of view obtained by the CBCT. Some landmarks that were of interest included the condyle, glenoid fossa, and the anterior and posterior nasal spines as well as the tip of the pulp chamber for the anterior teeth. However, the CBCTs of the patients did not include such landmarks in the field of view and many of them were thus cut off and not available for landmarking. This limits our data to only a few landmarks on the remaining CBCT slices and thus limits our findings. Findings that were not directly available due to this limitation include any angular changes to anterior teeth such as the overbite and overjet, in relation to the mandibular plane. Additionally, the relative inconsistency of the anteroposterior repositioning of the hyoid bone may be the result of this limitation: because some of the anterior portions of the hyoid bone were cut off by the small field of view, accuracy in the AP landmarks of this area may be limited.
This study was not followed up for a long period of time; thus, any changes in the AP or vertical dimensions involving the condyle and hyoid bone remain unidentified as to whether these changes were due to simple repositioning of the anatomical structures by the MAD or if there was actual remodelling of some sort of the skeletal features, such as the condyle remodelling to the glenoid fossa.
CONCLUSION
Vertical linear skeletal changes with placement of a MAD includes a tendency of a +31.12% vertical increase of the mandible relative to the maxilla, considering the vertical height of the MAD. Additionally, there is a +4.73 % vertical increase of the mandible relative to the superoanterior C2 anterior tubercle, and a -1.88% tendency of superior movement of hyoid bone relative to the mandible.
AP linear changes include a 3.86% mandibular protrusion relative to the cervical vertebrae and a 1.81% anterior movement of the hyoid bone relative to the cervical vertebrae. There is also a 1.07% anterior movement of the hyoid bone relative to the maxilla.
Angular movements include the rotation of the hyoid bone antero-superiorly by an average of -10.51%. The degree of the hyoid bone rotation may be larger than the amount of mandibular rotation, however, large bilateral variability of these measurements makes this difference clinically insignificant at this point in time.
Skeletal repositioning with use of the MAD gives a guide for clinicians to predict outcomes of skeletal changes. This repositioning should be correlated with patient symptoms to determine whether short- or long-term usage of the MAD is indicated for patients. Assessing specific tendencies with the use of the MAD will help clinicians to also predict outcomes of skeletal changes to ultimately decide the best candidates for this type of treatment.
ABBREVIATIONS
ANB: A point- nasion- B point
AP: anteroposterior
CBCT: cone beam computed tomography
Dx: diagnosis stage
MAD: mandibular advancement device
MAD- Dx: mandibular advancement device to diagnosis stage
OSA: obstructive sleep apnea
SNA: sella- nasion- A point
SNB: sella- nasion- B point
SN-MPI: sella-nasion to mandibular plane angle
REFERENCES
- Peppard PE, Young T, Barnett JH, Palta M, Hagen EW, Hia KM. Increased prevalence of sleep-disordered breathing in adults. Am J Epidemiol. 2012;177(09):1006–1014. doi: 10.1093/aje/kws342
- Hoth KF, Zimmerman ME, Meschede KA, Arnedt JT, Aloia, MS. Obstructive sleep apnea: impact of hypoxemia on memory. Sleep Breath 2013;17(2):811-817. doi:10.1007/s11325-012-0769-0.
- Ng A, Kotsopoulos H, Darendeliler AM, Cistulli PA. Oral appliance therapy for obstructive sleep apnea. Treat Respir Med. 2005;4(6):409-422.
- Basyuni S, Barabas M, Quinnell T. An update on mandibular advancement devices for the treatment of obstructive sleep apnoea hypopnoea syndrome. J Thorac Dis. 2018;10(Suppl 1):S48-S56. doi:10.21037/jtd.2017.12.18.
- Aarab G, Lobbezoo F, Heymans MW, Hamburger HL, Naeije M. Long-term follow-up of a randomized controlled trial of oral appliance therapy in obstructive sleep apnea. Respiration. 2011;82(2):162-168. doi:10.1159/000324580.
- Durán-Cantolla J, Crovetto-Martinez R, Alkhraisat MH, et al. Efficacy of mandibular advancement device in the treatment of obstructive sleep apnea syndrome: A randomized controlled crossover clinical trial. Med Oral Patol Oral Cir Bucal. 2015;20(5):e605-15). doi:10.4317/medoral.20649.
- Bratton DJ, Gaisl T, Schlatzer C, Kohler M. Comparison of the effects of continuous positive airway pressure and mandibular advancement devices on sleepiness in patients with obstructive sleep apnoea: a network meta-analysis. Lancet Respir Med. 2015;3(11):869-878. doi:10.1016/s2213-2600(15)00416-6.
- Sutherland K, Cistulli P. Mandibular advancement splints for the treatment of sleep apnea syndrome. Swiss Med Wkly. 2011;141:w13276. doi:10.4414/smw.2011.13276.
- Barrera JE, Pau CY, Forest VI, Holbrook AB, Popelka GR. Anatomic measures of upper airway structures in obstructive sleep apnea. World J Otorhinolaryngol Head Neck Surg. 2017;3(2):85-91. doi:10.1016/j.wjorl.2017.05.002.
- Özbek MM, Toygar UT. Oropharyngeal airway dimensions and functional-orthopedic treatment in skeletal Class II cases. Angle Orthod 1998;68(4):327-336. doi:10.1043/0003 3219(1998)068<0327:OADAFO>2.3.CO;2.
- Knappe SW, Sonnesen L. Mandibular positioning techniques to improve sleep quality in patients with obstructive sleep apnea: current perspectives. Na Sci Sleep 2018;10:65-72. doi:10.2147/nss.s135760.
- Lagravère MO, Carey J, Toogood RW, Major PW. Three-dimensional accuracy of measurements made with software on cone-beam computed tomography images. Am J Orthod Dentofacial Orthop. 2008;134(1):112-116. doi:10.1016/j.ajodo.2006.08.024.
- Zamora N, Cibrián R, Gandia JL, Paredes V. A new 3D method for measuring cranio-facial relationships with cone beam computed tomography (CBCT). Med Oral Patol Oral Cir Bucal. 2013;18(4):e706-713. doi:10.4317/medoral.18671.
- Pinsky HM, Dyda S, Pinsky RW, Misch KA, Sarment DP. Accuracy of three-dimensional measurements using cone-beam CT. Dentomaxillofac Radiol. 2006;35(6):410-416. doi:10.1259/dmfr/20987648.
- Lascala CA, Panella J, Marques MM. Analysis of the accuracy of linear measurements obtained by cone beam computed tomography (CBCT-NewTom). Dentomaxillofac Radiol. 2004;33(5):291-294. doi:10.1259/dmfr/25500850.
- Marmulla R, Wörtche R, Mühling J, Hassfeld S. Geometric accuracy of the NewTom 9000 Cone Beam CT. Dentomaxillofac Radiol. 2005;34(1):28-31. doi:10.1259/dmfr/31342245.
- Periago DR. Comparative linear accuracy and reliability of cone beam CT derived 2-dimensional and 3-dimensional images constructed using an orthodontic volumetric rendering program [thesis]. Louisville, KY, University of Louisville;2007. doi:10.18297/etd/1116.
- Stratemann SA, Huang JC, Maki K, Miller AJ, Hatcher DC. Comparison of cone beam computed tomography imaging with physical measures. Dentomaxillofac Radiol. 2008;37(2):80-93. doi:10.1259/dmfr/31349994.
- Petri N, Svanholt P, Solow B, Wildschiødtz G, Winkel P. Mandibular advancement appliance for obstructive sleep apnoea: results of a randomised placebo controlled trial using parallel group design. J Sleep Res. 2008;17(2):221-229. doi:10.1111/j.1365-2869.2008.00645.x.
- Hammond RJ, Gotsopoulos H, Shen G, Petocz P, Cistulli PA, Darendeliler MA. A follow-up study of dental and skeletal changes associated with mandibular advancement splint use in obstructive sleep apnea. Am J Orthod Dentofacial Orthop. 2007;132(6):806-814. doi:10.1016/j.ajodo.2005.08.047.
- Mitchell DL, Jordan JF, Ricketts RM. Arcial growth with metallic implants in mandibular growth prediction. Am J Orthod. 1975;68(6):655-659. doi:10.1016/0002-9416(75)90099-8.
- Gale A, Kilpeläinen PV, Laine-Alava MT. Hyoid bone position after surgical mandibular advancement. Eur J Orthod. 2001;23(6):695-701. doi:10.1093/ejo/23.6.695.
- Battagel JM, Johal A, L’Estrange PR, Croft CB, Kotecha B. Changes in airway and hyoid position in response to mandibular protrusion in subjects with obstructive sleep apnoea (OSA). Eur J Orthod. 1999;21(4):363-376. doi:10.1093/ejo/21.4.363.
- Kirjavainen M, Kirjavainen T. Maxillary expansion in Class II correction with orthopedic cervical headgear. A posteroanterior cephalometric study. Angle Orthod. 2003;73(3):281-285.
- Sahoo NK, Jayan B, Ramakrishna N, Chopra SS, Kochar G. Evaluation of upper airway dimensional changes and hyoid position following mandibular advancement in patients with skeletal Class II malocclusion. J Craniofac Surg. 2012;23(6):e623-627. doi:10.1097/scs.0b013e318270fafd.
- Khalil WS, Mageet, AO. Immediate effect of twin block appliance on the airway on a sample of patients with Class II division 1 malocclusion on skeletal II base. Int J Dent Oral Sci. 2017:464-470. doi:10.19070/2377-8075-1700091.
- Ozbek M, Miyamoto K, Lowe AA, Fleetham JA. Natural head posture, upper airway morphology and obstructive sleep apnoea severity in adults. Eur J Orthod. 1998;20(2):133-143. doi:10.1093/ejo/20.2.133.
- Naji P, Alsufyani NA, Lagravère MO. Reliability of anatomic structures as landmarks in three-dimensional cephalometric analysis using CBCT. Angle Orthod. 2014;84(5):762-772. doi:10.2319/090413-652.1.
- Mayoral P, Lagravère MO, Míguez-Contreras M, Garcia M. Antero-posterior mandibular position at different vertical levels for mandibular advancing device design. BMC Oral Health. 2019;19(1):85). doi.10.1186/s12903-019-0783-8.
- Geoghegan F, Ahrens A, McGrath C, Hägg U. An evaluation of two different mandibular advancement devices on craniofacial characteristics and upper airway dimensions of Chinese adult obstructive sleep apnea patients. Angle Orthod. 2015;85(6):962-968. doi:10.2319/040314-245.1.
- Poon KH, Chay SH, Chiong KF. Airway and craniofacial changes with mandibular advancement device in Chinese with obstructive sleep apnoea. Ann Acad Med. 2008;37(8):637-644.
- Tsai HH, Ho CY, Lee PL, Tan CT. cephalometric analysis of nonobese snorers either with or without obstructive sleep apnea syndrome. Angle Orthod. 2007;77(6):1054-1061. doi:10.2319/112106-477.1.
- Deljo E, Filipovic M, Babacic R, Grabus J. Correlation analysis of the hyoid bone position in relation to the cranial base, mandible and cervical part of vertebra with particular reference to bimaxillary relations / teleroentgenogram analysis. Acta Inform Med. 2012;20(1):25-31. doi:10.5455/aim.2012.20.25-31.
- Malkoc S, Usumez S, Nur M, Donaghy CE. Reproducibility of airway dimensions and tongue and hyoid positions on lateral cephalograms. Am J Orthod Dentofacial Orthop. 2005;128(4):513-516. doi:10.1016/j.ajodo.2005.05.001.
- Kim Y-K., Kim J-W., Yoon I-Y., Rhee CS, Lee CH, Yun P-Y. Influencing factors on the effect of mandibular advancement device in obstructive sleep apnea patients: analysis on cephalometric and polysomnographic parameters. Sleep Breath. 2013; 18(2):305–311. doi: 10.1007/s11325-013-0885-5
- Sakamoto Y, Yanamoto S, Rokutanda S, et al. Predictors of obstructive sleep apnoea-hypopnea severity and oral appliance therapy efficacy by using lateral cephalometric analysis. J Oral Rehabilitation. 2016;43(9):649–655. doi: 10.1111/joor.12408
SUBMISSION & CORRESPONDENCE INFORMATION
Submitted for publication June 24, 2019
Submitted in final revised form November 12, 2019
Accepted for publication December 13, 2019
Address correspondence to: Da In Kim, University of Alberta, #301-11003 29A Ave. NW, Edmonton, AB T6J 4S8, CANADA; Email: dain1@ualberta.ca
DISCLOSURE STATEMENT
FIGURES AND TABLES
Figure 1Illustrative depictions of linear distance measurements on isosurface mode on AVIZO software (isosurface 400 threshhold) |
Figure 2Illustrative depictions of angular distance measurements solely on isosurface mode on AVIZO software |
Figure 3Number of patients with significantly improved PSQI global score (RCI<-1.96) (objectively measured CPAP compliance and self-reported MAD compliance, >4 hours, >50% of nights). |
Table 1Anatomic landmarks and their definitions |
Table 2Mean measurements errors for each landmark and their corresponding standard deviations |
Table 3Statistics of skeletal/dental landmark distances of patients in their initial images and their equivalents with the MAD in place. Includes average mean measurements, standard deviation, the difference between these two measurements, and the ratio of the diagnostic distances to the MAD distances in percentage format and 95% confidence intervals. Starred (*) values indicate statistical significance with p-values<0.05). Negative ratio values indicate that the distance measured with the MAD is shorter than the initial diagnostic distance measurement. |
Table 4Statistics of skeletal/dental landmark angles of patient of their initial image and their equivalents with the MAD in place. Includes average mean measurements, standard deviation, the difference between these two measurements, and the ratio of the diagnostic angles to the MAD angles in percentage format and 95% confidence intervals. Starred (*) values indicate statistical significance with p-values<0.05). Negative ratio values indicate that the angles measured with the MAD is smaller than the initial diagnostic angle measurement. |