Original Article 2, Issue 7.1
Role of Facial Pattern in Patients with Obstructive Sleep Apnea Among the South Indian (Chennai) Population: A Cross-Sectional Study
http://dx.doi.org/10.15331/jdsm.7106
A. Mercy Anand, MDS1, Rekha Bharadwaj, MDS, DIBO2, N.R. Krishnaswamy, MDS, Morth. RCS[Ed], Dip.NB(ortho)3
1Private Practice, India, 2Ragas Dental College and Hospital, Department of Orthodontics and Dentofacial Orthopedics, Uthandi, Chennai, India, 3Ragas Dental College and Hospital, Department of Orthodontics and Dentofacial Orthopedics, Uthandi, Chennai, India
ABSTRACT
Study Objectives:
To assess the role of facial pattern as a contributing factor in patients with obstructive sleep apnea (OSA) and to study the relationship between craniofacial abnormalities, obesity, and severity of OSA.
Materials and Methods:
A total of 90 adult patients in the age group of 20 to 65 years who received a diagnosis of OSA with apnea-hypopnea index (AHI) of 10 events/h by overnight polysomnography were chosen for the study. The data included patient age, sex, polysomnography report, body mass index, and neck circumference. Lateral cephalograms were obtained for all the subjects in a standardized natural head position with the teeth in maximum intercuspation. All the lateral cephalograms were scanned and digitized using Dolphin software by a single observer to evaluate the craniofacial pattern.
Results:
OSA was predominantly seen among the middle-aged males. Approximately 50% of the patients had severe OSA and demonstrated the following significant craniofacial and soft- tissue abnormalities such as maxillary and mandibular retrognathism with decreased mandibular length, class II skeletal pattern, increased lower anterior facial height resulting in hyperdivergent face, and anteroinferiorly positioned hyoid bone. There was a significant increase in soft-tissue length and thickness and decreased posterior airway space. Mandibular position (SNB angle) was the single most important cephalometric variable that was strongly associated in determining the severity of OSA.
Conclusions:
There is a well-established relationship between obstructive sleep apnea syndrome and craniofacial morphology in patients exhibiting craniofacial abnormalities.
Keywords:
Obstructive Sleep Apnea, Polysomnography, Craniofacial Abnormalities, Neck Circumference, Body Mass Index
Citation:
Anand AM, Bharadwaj R, Krishnaswamy NR. Role of facial pattern in patients with obstructive sleep apnea among the South Indian (Chennai) population: a cross-sectional study. J Dent Sleep Med. 2020;7(1)
INTRODUCTION
Obstructive sleep apnea (OSA) is increasingly being recognized as a serious public health problem and is characterized by repeated collapse of the upper airway during sleep, thereby impairing quality of life.1 The etiology is often multifactorial. Patients with obstructive sleep apnea (OSA) are often obese, which is associated with parapharyngeal infiltration of fat, increased neck circumference, and increased size of the soft palate and tongue. However, some patients have airway obstruction due to the receding jaw, resulting in insufficient room for the tongue and thereby decreasing the cross-sectional area of the upper airway.2
OSA was found to be higher among middle-aged men than in women, with a percentage of 24% and 9% respectively. Nevertheless, the distribution of OSA is worldwide, with the highest prevalence in the United States (16.5%) followed by India (13.7%), Singapore (11.7%), Malaysia (6.6%), Chinese (6.2%), and Korea (6%), with the lowest in Japan (3.7%).1,3,4
Moreover, Asians are at a greater risk for more severe forms of OSA, although they are not as obese as their Caucasians or the African-American counterparts, due to the alterations in the craniofacial structures.5 The role of craniofacial abnormalities in patients with OSA have been studied previously using lateral cephalometry, which demonstrated that patients with OSA had significant craniofacial skeletal and soft-tissue abnormalities in comparison with control patients.6-8 There is sufficient evidence in the literature showing that retrognathic mandible and retropositioned tongue play a pivotal role in contributing to narrowing and obstruction in patients with OSA.
Obesity is considered a major risk factor contributing to OSA severity. However, it is believed that there is a significant association between obesity, craniofacial morphology and severity of OSA.9-11 Body mass index (BMI) and neck circumference (NC) are some of the important predictors of OSA among the obese patients, thus explaining the different etiologic basis.11
Although skeletal class II malocclusion has been found to be quite common among the Asian population and mandibular retrognathism is a significant contributor to the Class II malocclusion facial pattern, the role of Class II malocclusion and mandibular retrognathism predisposing to OSA and the relationship between craniofacial abnormalities, obesity, and severity of OSA has not been studied and validated among the South Indian (Chennai) population.
AIM OF THE STUDY
To assess the role of facial pattern as a contributing factor in patients with OSA and to study the relationship between craniofacial abnormalities, obesity, and severity of OSA.
MATERIALS AND METHODS
Participants in this study were recruited from various sleep centers and ear, nose, and throat clinics/hospitals across different parts of South India (Chennai). An informed consent was obtained from all the participants. The selection criteria included (1) age range of 20 to 65 years; (2) OSA diagnosed by a sleep medicine specialist based on a standardized polysomnography; (3) no previous surgical or palliative treatment; (4) no previous orthodontic or orthognathic surgical treatment; (5) no craniofacial syndrome. The study data included patient age, sex, polysomnography report, BMI, and NC.
Each patient underwent overnight polysomnography. “Sleep and various stages were recorded by standard electroencephalographic (EEG), electro-oculographic (EOG), and electromyographic (EMG) criteria. A single electrocardiography (ECG) lead was monitored to detect cardiac arrhythmias. Oronasal airflow was recorded by an end-tidal carbon dioxide analyzer that recorded from both nose and the throat.” 8,10 Arterial oxygen saturation was checked using a pulse oximeter attached to the index finger. Chest wall movements were recorded using respiratory inductance plethysmography. OSA was defined as the cessation of airflow for at least 10 seconds in the presence of inspiratory effort.12
All the participants received a lateral cephalometric radiograph (KODAK 8000C Digital cephalometric system) taken with the head in a natural position and teeth placed in maximum intercuspation. To standardize the hyoid position, the exposures are done at the end of expiration. 13
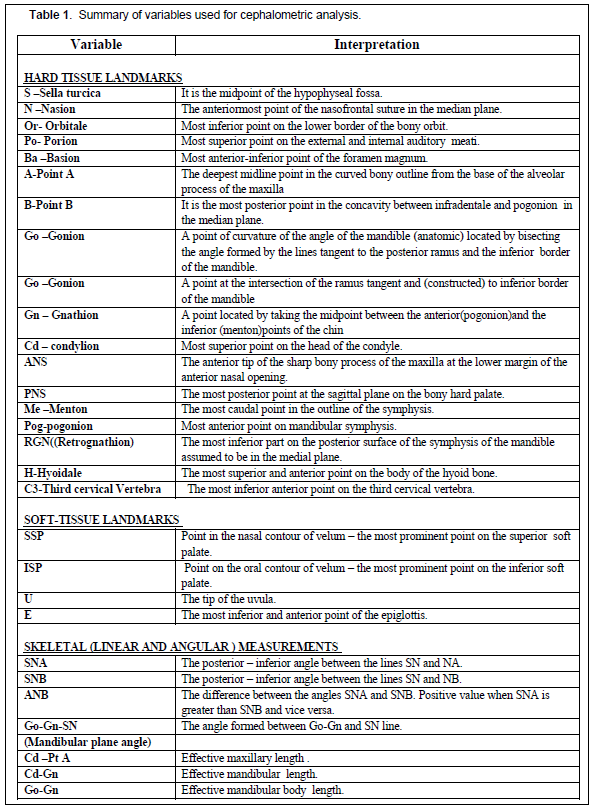
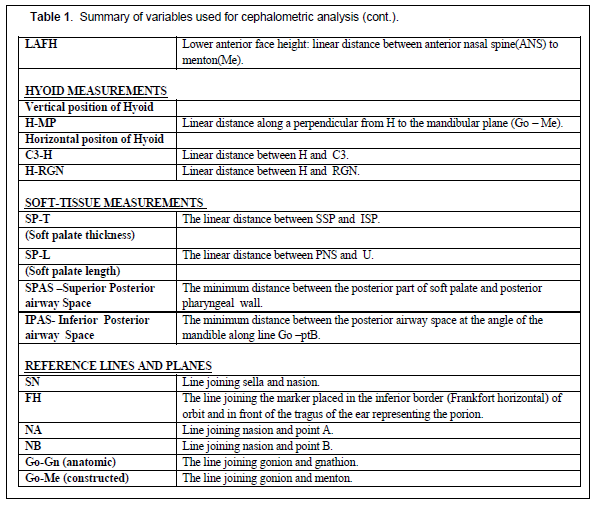
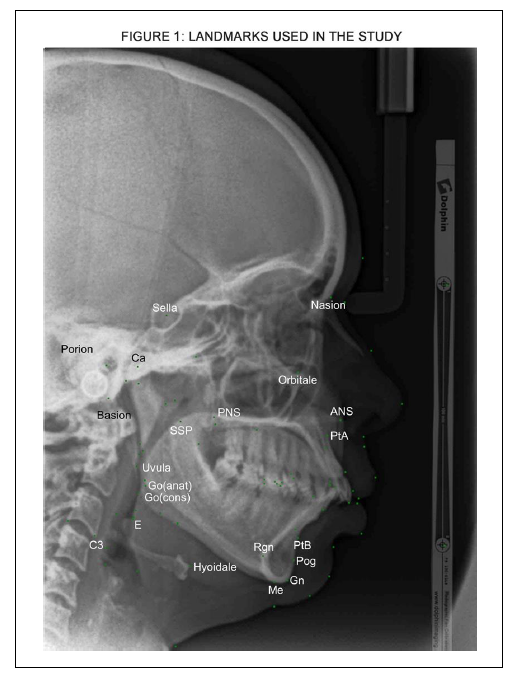
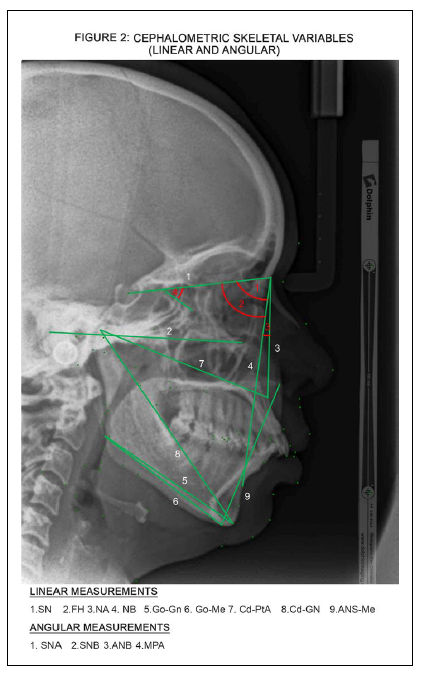
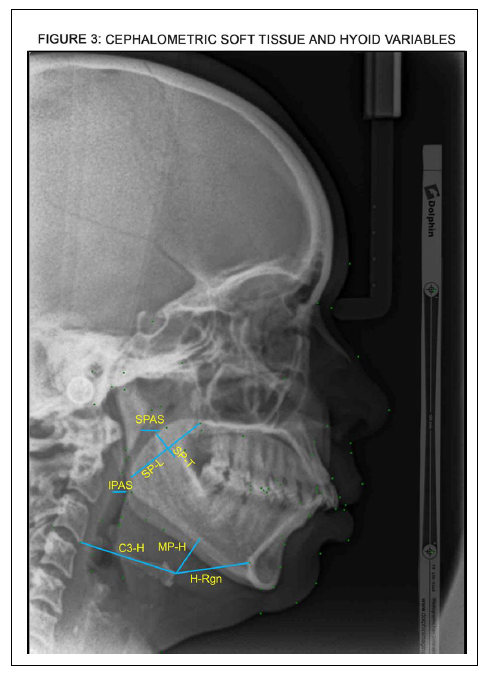
All the lateral cephalograms were scanned and digitized using Dolphin software (Patterson Dental, St. Paul, MN) by a single observer to evaluate the craniofacial pattern. To reduce the effect of operator measurement error, the tracings were made at three separate times and the degree of reproducibility was assessed. The landmarks, reference planes, and measurements (linear and angular) were chosen for the current study based on a study done by Battagel6 (Table 1) (Figures 1, 2, and 3).
STATISTICAL ANALYSIS
Demographic and sleep data were calculated and tabulated. An intraclass correlation coefficient was obtained to test the reproducibility of the measurements. The Kolmogorov-Smirnov test was done to study the difference in cephalometric measurements in OSA patients compared to the normal values. Analysis of variance was done to evaluate the difference between the mean values of the cephalometric measurements in different AHI, BMI, and NC subgroups. Pearson correlation coefficient was performed to study the relationship between AHI, BMI, and NC and multiple regression analysis was used to understand the weight of craniofacial morphology in the pathogenesis of OSA when age, BMI, and AHI were used as covariates. The statistical analysis was performed with SPSS software and statistical significance level was set at P < 0.05.
RESULTS
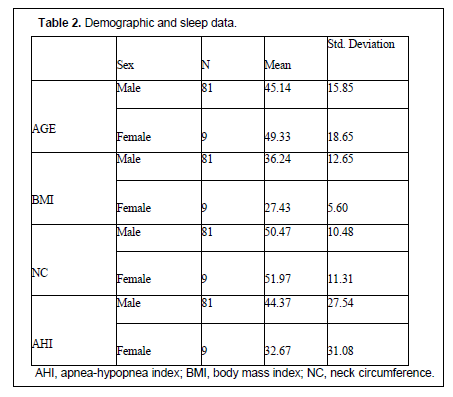
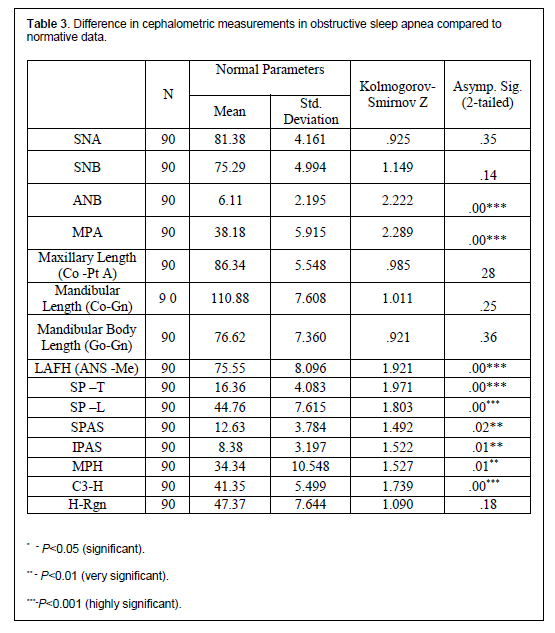
A total of 90 patients were recruited for the study. The demographic and sleep data are summarized in Table 2. The sample size clearly reflects the preponderance of males having OSA and is predominantly seen among the middle-aged population. The mean values for AHI were 44.37 events/h in males and 32.67 events/h in females, showing that 50% of patients had severe forms of OSA. An AHI < 15 events/h was considered mild; 16 to 30 events/h as moderate, and AHI > 30 events/h was considered as severe OSA.2 The mean BMI was found to be 36.24 kg/m² in males and 27.4kg/m² in females and NC were 50.47 cm and 41.97 cm, respectively. Approximately 56.6% of patients were obese, indicating that more than 50% of patients were obese with greater OSA severity. The degree of reproducibility of the measures calculated using intraclass correlation coefficient was 1.00, which suggests they were almost identical.Table 3 shows the cephalometric variables of patients with OSA compared to their normative data. Patients with OSA had greater ANB angle demonstrating class II skeletal pattern with a high mandibular plane angle and increased LAFH showing a tendency toward a hyper-divergent face. The hyoid bone was positioned anteroinferiorly in most patients with OSA. Soft-tissue measurements showed increased length and thickness and soft palate with a significant reduction in the superior and inferior posterior airway space.
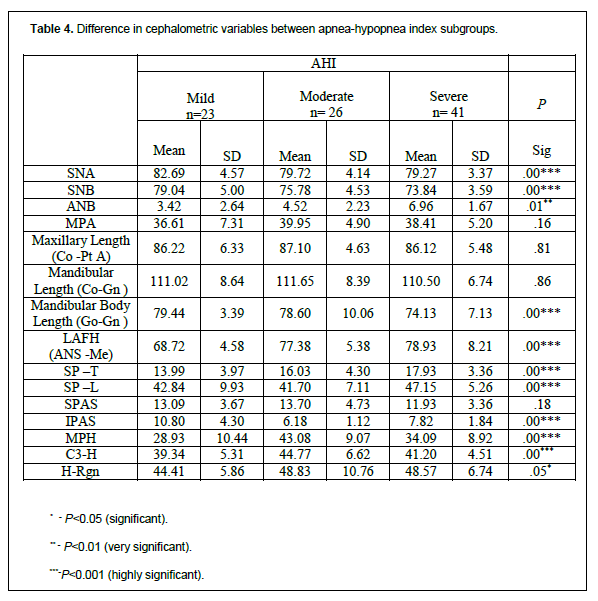
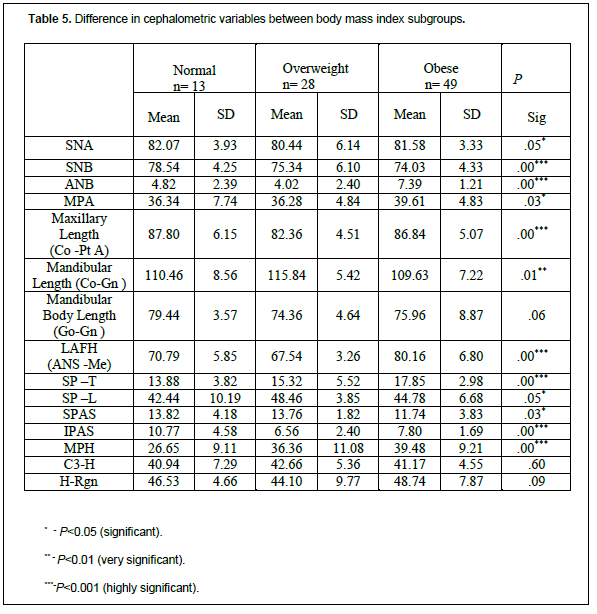
The difference between the mean values of cephalometric measurements in the different AHI subgroups is shown in Table 4. Results showed that the following hard and soft tissue cephalometric variables were significantly different within the AHI subgroups; SNA (P< .00), SNB (P<.00), ANB (P< .01), mandibular body length (Go-Gn) (P< .00) LAFH (P< .00), MPH (P< .00) C3H (P< .00), SPT (P< .00), SPL (P< .00) and IPAS (P< .00). Similarly the difference between the mean values of cephalometric variables in the different BMI subgroups (Table 5) showed the following cephalometric variables to be significantly different with the BMI subgroups; SNB (P< .00), ANB (P< .00), MPA (P< .03), mandibular length (Co-Gn) (P< .01) maxillary length (co-pt A) (P< .00), LAFH (P< .00), MPH (P< .00), C3-Rg (P< .03), SPT (P< .00), SPAS (P< .03) and IPAS (P< .00).
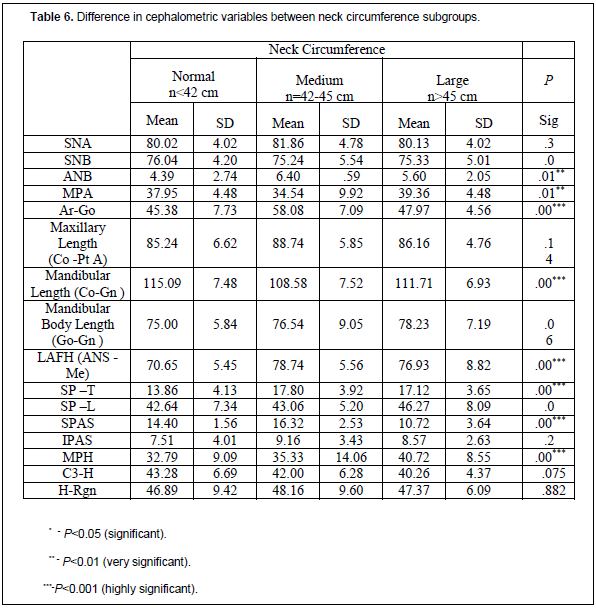
The mean values of cephalometric measurements within NC subgroups (Table 6) showed the following cephalometric variables to be significantly different with the NC subgroups: ANB (P< .01), MPA (P< .01), mandibular length (Co-Gn) (P< .00), LAFH (P< .00), MPH (P< .00), SPAS (P< .00) and SPT (P< .00).
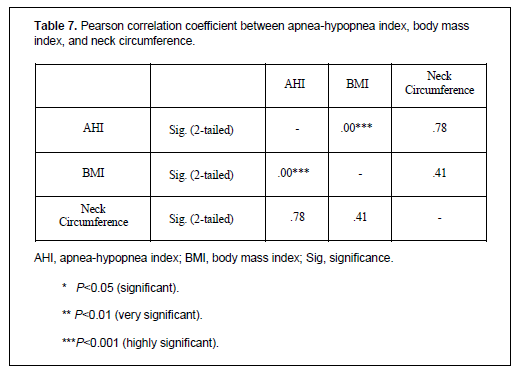
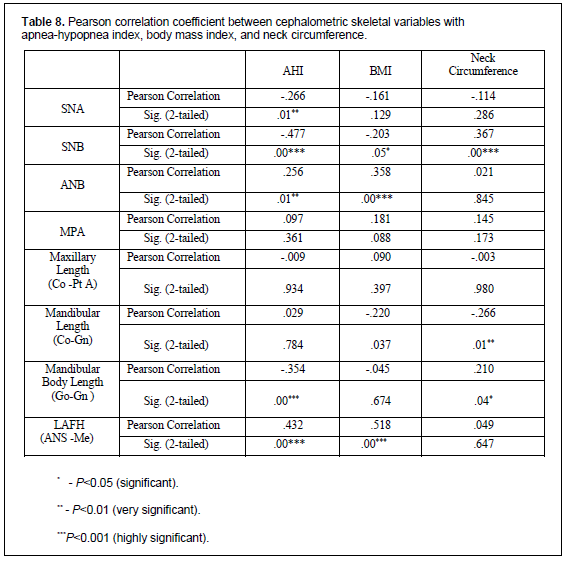
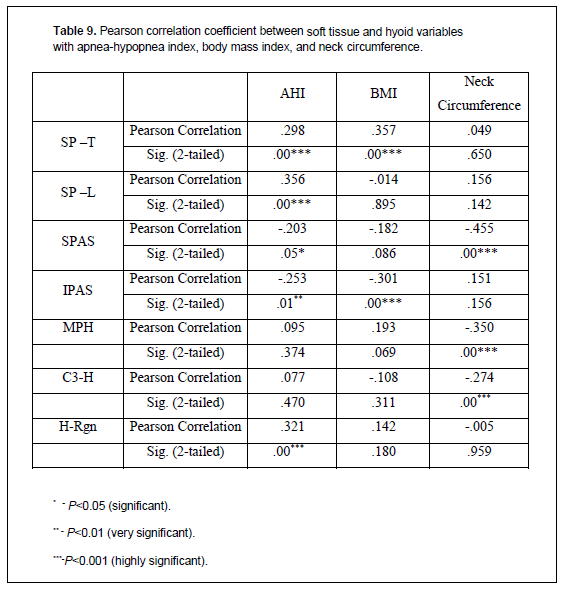
Pearson correlation coefficient (Tables 7, 8, and 9 ) showed that AHI and BMI were found to be strongly positively correlated whereas NC failed to show any correlation Nevertheless, the relationship between AHI and cephalometric measurements elicited that AHI was found to have strong negative correlation with SNB angle, mandibular body length, and strong positive correlation with LAFH, H-Rgn, and soft palate thickness and length. However, SPAS and IPAS elicited a weak correlation with AHI. The relationship between cephalometric variables and BMI demonstrated significantly strong positive correlation with ANB angle, LAFH, soft palate thickness, and negative correlation with IPAS. Mandibular length and SNB angle was found to be weakly correlated with BMI. The relationship between the cephalometric variables and NC showed strong negative correlation with SNB angle, SPAS, and C3-H and a strong positive correlation with MPH. However, NC failed to elicit a strong correlation with total mandibular length and mandibular body length.
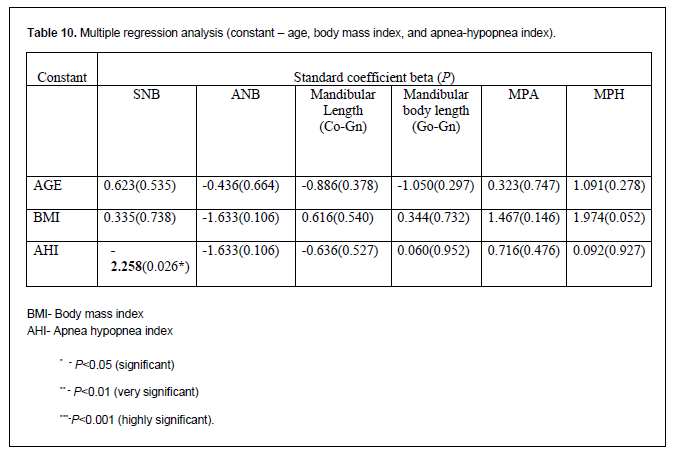
Multiple regression analysis (Table 10) was done to understand the role of craniofacial morphology in the pathogenesis of OSA and results showed that mandibular position determined by SNB angle was the only cephalometric variable that elicited a strong predictive equation in determining the severity of OSA based on AHI.
DISCUSSION
OSA is one of the most common breathing disorders worldwide and the prevalence rate in India is 13.7%.14 Chennai, being a cosmopolitan city, reflects its diverse population exhibiting 62% of the migrants from other parts of the state and 34% from other parts of India. Therefore, samples of the study were collected from different sleep centers in Chennai thus representing the South Indian population. Although OSA is prevalent in both sexes, male preponderance is clear and commonly seen among the middle-aged population. With the increase in number of skeletal Class II malocclusions among the Asian population and greater prevalence of OSA in India, the exact relationship between craniofacial structures and the severity of OSA has not been studied particularly in the South Indian (Chennai) population.
Therefore, the current study aimed to assess the role of facial pattern as a significant factor in patients with OSA and to study the relationship between craniofacial abnormalities, obesity, and severity of OSA. Although there are several three-dimensional imaging techniques such as cone beam computed tomography and magnetic resonance imaging available to study the craniofacial and airway dimensions, the current study used lateral cephalometry because it was less expensive, relatively simple, and cost effective.
Craniofacial abnormalities8,15 have also been found to play a pivotal role in the pathogenesis of OSA by causing narrowing of the upper airway through alteration in the craniofacial structures. In the current study, 74% of the patients with OSA had craniofacial abnormalities such as a larger ANB with high mandibular plane angle and increased lower anterior facial height exhibiting a tendency toward a hyperdivergent facial pattern.
The importance of the hyoid bone is in its unique anatomic relationships with soft- tissue structures such as suprahyoid and infrahyoid muscles without any bony articulations.16 The sagittal position of the jaws and height of the face have an important role in hyoid position as the suprahyoid muscles are attached to the mandible or tongue.14 In general, factors such as increased facial height and a clockwise mandibular rotation lead to inferior positioning of the hyoid bone. However, it has been postulated that the anteroinferior position of the hyoid bone could also be a compensatory adaptation taking place in order to increase the patency of airway in patients with OSA.6,16 Lowe 15 and Partinen et al17 reported that in patients with OSA, a high AHI was more likely to have inferiorly placed hyoid bone to mandibular plane. Likewise in the current study, patients demonstrated an anteroinferior displacement of hyoid bone in relation to the mandibular plane in patients with severe OSA.
Relationship of AHI and Obesity (BMI and NC)
There are several cross-sectional studies that have revealed an identical relationship between OSA, BMI, NC, and other measures of body habitus.10,11 Some studies have reported that BMI was significantly positively correlated with AHI, suggesting that obese patients have greater tendency for severe OSA. 18-21
In the current study, 51 patients were obese, 15 patients were overweight, and 24 patients were of normal weight, attributing that more than half of the subjects (35.36 kg/m2) were in the obese category. When divided into subgroups based on BMI, the AHI showed a mean value of 34.15 evens/h in obese patients, which was significantly greater than patients who were overweight (26.80 events/h) and at normal weight (23.12 events/h), indicating that obese patients were more prone to severe forms of OSA.
NC, a simple clinical measurement, reflects the fat deposition in the neck region surrounding the upper airway. In the current study, neck circumference was divided into subgroups as normal (n < 42 cm ), medium (n = 42-45 cm ) and large (n > 45 cm). Patients with OSA have been shown to have a greater NC with the highest mean value in patients with high BMI, thus reflecting greater tendency for the airway collapsibility through fat deposition in the neck region. Similar results have been obtained previously in literature.10,20-23
AHI and Cephalometric Measurements
AHI was classified according to the American Academy of Sleep Medicine as mild OSA with AHI of 5 to 15 events/h, moderate as 16 to 30 events/h, and severe as >30 events/h.2 In the current study, more than 50% of patients had severe OSA, thus explaining the increased severity of the disease in the sample population. Several studies have attempted to establish a direct association between cephalometric measurements and severity of obstructive sleep apnea syndrome (OSAS).7,24-26 Maxillary and mandibular retrognathism have been found to play a pivotal role in decreasing the airway patency at retropalatal (velopharynx) and retroglossal (oropharynx) levels, respectively. The mandibular body length and total mandibular length is reduced in patients with severe OSA encroaching the tongue space, thereby causing the tongue to fall back, obstructing the oropharynx. This leads to downward and backward rotation of the mandible, causes an increase in lower anterior face height and a hyperdivergent facial pattern.
With regard to soft-tissue parameters, soft palate thickness and length were increased in severe OSA, causing narrowing and obstruction of the airway. Moreover, posterior airway space had a strong relationship with AHI and was significantly reduced in severe OSAS, suggesting that the abnormalities of the soft tissues such as the soft palate and tongue can encroach and obstruct the pharyngeal airway at the level of velopharynx and oropharynx respectively.
Obesity (BMI and NC) and Cephalometric Measurements
It is interesting to note that although the tendency for obesity among Asians was considered less compared to other population groups, more than 50% of patients with OSA (56.6%) in the current sample were obese. This explains the current trend of the Asian population having a high risk for obesity, probably due to alterations in lifestyle and food habits. The relationship between obesity and the craniofacial structures studied by Sakakibara et al27 reported that 60% of patients who were obese (BMI > 27 kg/m2) had greater soft-tissue abnormalities that predisposed them to OSA, whereas 54% of nonobese patients (BMI <27 kg/m2) demonstrated alteration in craniofacial structures contributing to OSA. In contrast, the current study revealed that obese individuals demonstrated abnormalities in both hard- and soft-tissue structures, such as deficient and retropositioned mandible, retrognathic maxilla, and increased lower anterior face height, thus explaining the combined contribution of obesity and craniofacial features to upper airway obstruction and severity of OSA.
The position of the hyoid bone was also altered in severe cases, indicating that hyoid bone was more caudally positioned in severe OSA cases.
Craniofacial Morphology in Pathogenesis of OSA
The role of craniofacial morphology in the pathogenesis of OSA has been studied previously.8,15 The current study demonstrated that mandibular position determined by SNB angle was the single most predictive variable in determining the severity of OSA based on AHI. This determines that patients with severe OSA had more a backwardly positioned mandible, causing the tongue to fall back and thereby obstructing the airway at the oropharynx.
CONCLUSION
There is a well-established relationship between OSAS and craniofacial morphology in patients exhibiting craniofacial abnormalities. It is interesting to note that a combination of craniofacial abnormalities and degree of obesity explains a large proportion of the population in determining the severity of OSA. Mandibular position (SNB angle) was the single most important cephalometric variable strongly associated in determining the severity of OSA.Clinical Implications
The knowledge and understanding of the various craniofacial abnormalities predisposing to OSA is important for both diagnosis and treatment planning. Although it is evident in the literature that obesity and craniofacial features have a strong ethnic background, the current study demonstrated a synergic effect of obesity and craniofacial risk factors that determine the development and severity of OSA. Perhaps the region and type of pharyngeal collapse is determined by the underlying causes such as obesity and craniofacial abnormalities.Limitations of the Study
Cephalometric radiography is a two-dimensional representation and therefore inadequate to measure three-dimensional structures such as craniofacial and airway structures. Soft-tissue structures such as the soft palate and posterior airway space are subjected to positional and functional airway space and therefore should be interpreted with caution. Furthermore, the etiology of OSA is multifactorial; the differing craniofacial abnormalities and its relationship to obesity is only part of the equation and the altered path-physiology of airway due to dynamic changes and associated systemic factors must also be recognized. Further studies with larger sample size and matched control patients are needed to elucidate the relationship between craniofacial anatomy and factors contributing to pathogenesis of OSA.
REFERENCES
- Ang PK, Sandham A, Tan WC. Craniofacial Morphology and Head Posture in Chinese Subjects with obstructive sleep apnea. Semin Orthod. 2004;10:90-96.
- Lowe AA. Treating obstructive sleep apnea. The case for oral appliances. Am J Orthod Dentofac Orthop. 2012; 142(4):436-440.
- Li K, Powell N, Kushida C, Riley R, Adornato B, Guilleminault C. A comparison of Asian and white patients with obstructive sleep apnea syndrome. Laryngoscope. 1999;109(12):1937-1940.
- Osama B. Albajalan, A. Samsudin R, Hassan R. Craniofacial morphology of Malay patients with obstructive sleep apnea. Eur J Orthod. 2011;33(5):509–514.
- Cakirer B, Hans M, Graham G, Aylor J, Tishler P, Redline S. The relationship between craniofacial morphology and obstructive sleep apnea in whites and in African – Americans. Am J Respir Crit Care Med. 2001;163(4):947-950.
- Battagel JM, L' Estrange PR. The cephalometric morphology of patients with obstructive sleep apnoea (OSA). Eur J Orthod. 1996;18(6):557-569.
- Battagel JM, Johal A, Kotecha BT. A cephalometric comparison of subjects with snoring and obstructive sleep apnea. Eur J Orthod. 2000;22(4):353-365.
- Lowe AA, Fleetham JA, Adachi S, Ryan CF. Cephalometric and computed tomographic predictors of obstructive sleep apnea. Am J Orthod Dentofac Orthop. 1995;107(6):189-195.
- Horner RL, Mohiaddian RH, Lowe DG, et al. Sites and sizes of fat deposits around the pharynx in obese patients with obstructive sleep apnea and weight matched controls. Eur Respir J. 1989;2(7):613-622.
- Ferguson KA, Ono T, Lowe AA, Ryan CF, Fleetham JA. The relationship between obesity and craniofacial structure in obstructive sleep apnea. Chest. 1995;108(2):375-381.
- Katz I, Stradling J, Slutsky AS, Zamal N, Hoffstein V. Do patients with obstructive sleep apnea have thick necks? Am Rev Respir Dis. 1990;141(5 Pt 1)1:1228-1231.
- Costa e Sousa RA, dos Santos Gil NA. Craniofacial skeletal architecture and obstructive sleep apnea syndrome severity. J Craniomaxillofac Surg. 2013;41(8):740-746.
- Johal A, Patel SI, Battagel JM. The relationship between craniofacial anatomy and obstructive sleep apnea: a case-controlled study. J Sleep Res. 2007;16(3):319-326.
- Vijayan VK, Patial K. Prevalence of obstructive sleep apnea syndrome in Delhi, India. Chest. 2006;130(4):92S.
- Lowe AA, Santamaria JD, Fleetham JA. Facial morphology and obstructive sleep apnea. Am J Orthod Dentofac Orthop. 1986;90(6):484-491.
- Bibby RE, Preston CB. The hyoid triangle. Am J Orthod. 1981;80(1):92-97.
- Partinen M, Guilleminault C, Quera-Salva M, Jamieson A. Obstructive sleep apnea and cephalometric roentgenograms. The role of anatomic upper airway abnormalities in the definition of abnormal breathing during sleep. Chest. 1988;93(6):1199-1205.
- Hoffstein V, Mateika S. Differences in abdominal and neck circumference in patients with and without obstructive sleep apnea. Eur Respir J. 1992; 5(4):377-381.
- Solow B, Siersbaek-Nielsen S, Greve E. Airway adequacy, head posture and craniofacial morphology. Am J Orthod Dentofac Orthop. 1984;86(3):214-223.
- Davies RJ Ali NJ, Stradling JR. Neck circumference and other clinical features in the diagnosis of the obstructive sleep apnea syndrome. Thorax. 1992;47(2):101-105.
- Davies RJ, Stradling JR. The relationship between neck circumference, radiographic pharyngeal anatomy, and the obstructive sleep apnea syndrome. Eur Respir J. 1990; 3(4):509-514.
- Sutherland K, Lee RW, Cistulli PA. Obesity and craniofacial structure as risk factors for Obstructive Sleep Apnea: Impact of ethnicity. Respirology. 2012;17(2):213-222.
- Naganuma H, Okamoto M, Woodson BT, Hirose H. Cephalometric and fiberoptic evaluation as a case-selection technique for obstructive sleep apnea syndrome. Acta Otolaryngol Suppl. 2002;(547):57-63.
- Pae EK, Lowe AA, Fleetham JA. A role of pharyngeal length in obstructive sleep apnea patients. Am J Orthod Dentofac Orthop. 1997;111(1):12-17.
- Miles PG, Vig VS, Weyant RJ, Forrest TD, Rockette HE Jr. Craniofacial structure and obstructive sleep apnea syndrome - a qualitative analysis and meta-analysis of the literature. Am J Orthod Dentofac Orthop. 1996;109(2):163-172.
- Preston CB. The upper airway in orthodontics. Semin Orthod. 2004;10:1-90.
- Sakakibara H, Tong M, Matsushita K, Hirata M, Konishi Y, Suetsugu S. Cephalometric abnormalities in non-obese and obese patients with obstructive sleep apnoea. Eur Respir J. 1999;13(2):403–410.
ACKNOWLEDGEMENTS
1. KKR ENT HOSPITAL & RESEARCH INSTITUTE KILPAUK, CHENNAI.
2. MADRAS ENT RESEARCH FOUNDATION (P)LTD CHENNAI.
3. AARTHI SCANS & LABS, KILPAUK, CHENNAI.
SUBMISSION & CORRESPONDENCE INFORMATION
Submitted for publication July 30, 2018
Submitted in final revised form December 8, 2018
Accepted for publication September 16, 2019
Address correspondence to: Rekha Bharadwaj M.D.S., DIBO, Ragas Dental College and Hospital, 1/102 East Coast Road, Uthandi Chennai India; Email: drrekhabharadwaj@gmail.com
DISCLOSURE STATEMENT
The authors have no conflicts of interest to disclose.
TABLES AND FIGURES
Table 1Summary of variables used for cephalometric analysis. |
Table 1 (cont.)Summary of variables used for cephalometric analysis. |
Table 2Demographic and sleep data. |
Table 3Difference in cephalometric measurements in obstructive sleep apnea compared to normative data. |
Table 4Difference in cephalometric variables between apnea-hypopnea index subgroups. |
Table 5Difference in cephalometric variables between body mass index subgroups. |
Table 6Difference in cephalometric variables between neck circumference subgroups. |
Table 7Pearson correlation coefficient between apnea-hypopnea index, body mass |
Table 8Pearson correlation coefficient between cephalometric skeletal variables with apnea-hypopnea index, body mass index, and neck circumference. |
Table 9Pearson correlation coefficient between soft tissue and hyoid variables with apnea-hypopnea index, body mass index, and neck circumference. |
Table 10Multiple regression analysis (constant – age, body mass index, and apnea-hypopnea index). |
Figure 1Landmarks used in the study (more ...) |
Figure 2Cephalometric skeletal variables (linear and angular) |
Figure 3Cephalometric soft tissue and hyoid variables |