Original Article 1, Issue 8.3
Comparison of Dental Arch Width and Length Parameters in Patients With Obstructive Sleep Apnea and a Control Group: A Pilot Study
http://dx.doi.org/10.15331/jdsm.7202
James Sacksteder, DDS, MS1,2; Allen Firestone, DDS, MS1; Do-Gyoon Kim, PhD1; F. Michael Beck, DDS, MA1; Ulysses Magalang, MD3; Cameron Anderson, DDS, MS1,4; Eun Sang Moon, DDS1
1Division of Orthodontics, College of Dentistry, The Ohio State University, Columbus, OH: 2Private practice, Charlotte, NC; 3Division of Pulmonary, Critical Care and Sleep Medicine College of Medicine, Wexner Medical Center, The Ohio State University, Columbus, OH; 4Private practice, Decatur, GA
ABSTRACT
Study Objective:
Limited data suggest a smaller, narrow maxilla can lead to a decreased oropharyngeal volume (OPV). However, past studies have used two-dimensional lateral cephalometric radiographs. The specific aim of this study is to assess how maxillary arch parameters relate to oropharyngeal volume calculated from three-dimensional cone beam computed tomography (CBCT) images. An additional aim was to compare these dimensions in a group of African-American patients with obstructive sleep apnea (OSA) with a group of healthy control patients.
Methods:
Sixteen full-head CBCT images in the closed-mouth anatomic position were obtained from adult male African-American patients with a diagnosis of OSA. The OPV was measured by counting corresponding voxels that are digitally isolated from the three-dimensional CBCT images after segmentation. Axial plane images of the same volume were used to measure intercanine width, intermolar width, arch length, and arch perimeter. In addition, 16 CBCT images were obtained from the control group of adult male African-American patients matched for age with no prior diagnosis of OSA. Each of the maxillary arch parameters was tested for correlation with oropharyngeal volume and compared between the two groups.
Results:
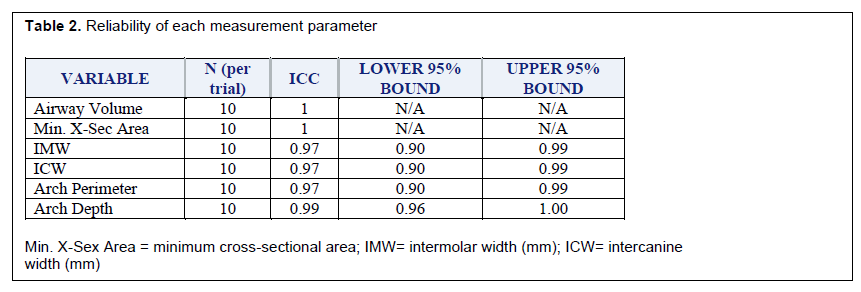
Reliability was tested and for all parameters the intraclass correlation coefficient was greater than 0.95 (0.97-1.00). The OSA group was significantly older than control patients (41.3+11.3 and 31.9±6.9 years, respectively). After accounting for multiple comparisons, the minimum cross-sectional area was the only parameter significantly different between groups (P = 0.0014). Minimum cross-sectional area was found to be a good-excellent predictor of OSA (area under receiver operating characteristic curve = 0.89). A cutoff point of 111 mm2 was determined for minimum cross-sectional area between groups.
Conclusions:
The CBCT-based imaging analysis produces reliable measurements for all parameters. The current findings suggest that maxillary arch width and length do not contribute to a smaller oropharyngeal airway. Minimum cross-sectional area is a good-excellent predictor of OSA in African-American adult males.
Keywords:
Obstructive Sleep Apnea, Airway Volume, Minimum Cross-sectional Airway, African-American, Arch Width, Arch Length, CBCT
Citation:
Sacksteder J, Firestone A, Kim DG, et al. Comparison of dental arch width and length parameters in patients with obstructive sleep apnea and a control group: A pilot study. J Dent Sleep Med. 2021;8(3)
INTRODUCTION
Obstructive sleep apnea (OSA) is a common disorder in which a person stops breathing (apnea) or has a reduced air volume into the lungs (hypopnea) during sleep. The obstruction occurs as a result of the collapse of the upper airway. This disorder is increasing in prevalence as the population increases in weight, the percentage of older individuals in the population increases, and is being diagnosed more frequently as physicians become more aware of the disease. As of 2002 OSA syndrome (an apnea-hypopnea index (AHI) >5 with excessive daytime sleepiness) was believed to affect 2% to 4% of the population.1 Currently, OSA is estimated to affect 14% of men and 5% of women.2
Sleep apnea is associated with substantial health problems, both psychological and physiological. Patients with untreated OSA are at an increased risk for stroke, diabetes, heart failure, irregular heartbeat, myocardial infarction, and hypertension,3 not only because of the lack of oxygenation but also increased sympathetic activity.1 Psychological deficits associated with untreated OSA include depression, anxiety, daytime sleepiness, and increased risk of motor vehicle accidents.1
There are many factors that are associated with increased risk of the development of OSA, including include overweight, a large neck size (17 inches in males, 16 inches in females), large tonsils or tongue, a decreased mandibular body length, increased mandibular plane to hyoid bone distance, family history, and male sex.4 However, not all patients with OSA are the stereotypical obese middle-aged male.5,6 For that reason it is important to identify other clinical conditions that will indicate with a high degree of accuracy that the probability of having OSA or the development of OSA is increased in certain individuals.
Previous studies to determine whether there were indicators of increased risk for OSA in an individual’s craniofacial dimensions have generally been performed on two-dimensional lateral cephalometric radiographs. One important limitation to this method of inquiry is the complex three-dimensional geometry of the airway that cannot be completely evaluated from a two-dimensional image. Current advances in computed tomography imaging allow the visualization and analysis of craniofacial structures in three dimensions. The use of cone beam computed tomography (CBCT) has been shown to be accurate and reliable in assessing airway volume.7 Further studies to examine craniofacial structures and dimensions would be more informative if data from three-dimensional imaging were used.
First developed in the 1980s, CBCT became commercially available to the European market in 1996 and subsequently the US market in 2001.8 Prior to the advent of CBCT, airway analysis was performed via two-dimensional lateral cephalometric radiographs, magnetic resonance imaging (MRI), multiple-detector computed tomography, and endoscopy. These imaging techniques come with the increased challenge of high cost and low availability, and in the case of CT, high radiation dose exposure. CBCT has been used to analyze airway as early as 2006. In discriminating between soft-tissue structures CBCT is inferior to multiple-detector computed tomography but is able to define the boundaries between soft tissues and empty spaces with high spatial resolution.9 This method has been shown to be accurate and reproducible in addition to its other advantages of being easily accessible, requiring a shorter acquisition time, lower effective radiation dose, and lower cost when compared to MRI or CT.
Because OSA is frequently the result of a neuromuscular anatomic condition in the oro-pharyngeal area,10 investigators have looked at the volume of the oral cavity and possible risk factors. The effects of extraction for orthodontic reasons on oral and pharyngeal dimensions has been the subject of several investigations. A study by Valiathan et al found no significant difference in oropharyngeal airway dimensions between adolescent patients with and without extractions during orthodontic treatment.11 Pliska et al reported similar findings in a group of adult patients.12 However, Wang et al reported that extraction of four premolars with retraction of the incisors decreased pharyngeal dimensions.13 The results of this latter study agree with those reported by Germec-Cakan et al;14 together these studies suggest that decreasing the arch length can result in less space in the oral cavity for the tongue. The argument is that the tongue in turn will move posteriorly, encroaching on the oropharyngeal airway space and reducing airway volume. When Seto et al4 looked at maxillary morphology in patients with OSA compared with control patients, they reported that patients with OSA had narrower, more tapered, and shorter maxillary arches than control patients without OSA.
Evidence suggests ethnicity may be a risk factor for OSA. Sutherland et al reported very similar rates of OSA prevalence for populations around the world.15 This finding is surprising given the various obesity rates, demographics, and variations in craniofacial structure found in different ethnicities. The contribution to OSA will vary among ethnicities with respect to upper airway soft tissues, obesity, and craniofacial bony dimensions. One study suggests that African-Americans with OSA have a larger contribution of soft tissue enlargement.16 This is in contrast to whites having a contribution from both soft tissue and skeletal characteristics. Asians have been found to have a larger contribution from skeletal restriction. It is clear that understanding ethnicity-specific craniofacial risk factors is particularly important.
There is a deficiency in knowledge concerning dental parameters of OSA. These parameters have never been studied in an African-American population. The aim of this study was to compare dental parameters that contribute to size of the oral cavity in a group of African American patients in whom OSA was diagnosed with those of a control group. The aim was to investigate whether these arch parameters (length and width) relate to oropharyngeal volume calculated from a three-dimensional CBCT image in African-American patients.
MATERIALS AND METHODS
A sample of CBCT images obtained from adult African-American patients with diagnosed OSA was obtained from an existing database in Digital Imaging and Communications in Medicine format after identifying information had been removed. Twenty-one images were initially included in this database. The images from this sample make up the OSA group. A control group was obtained by applying screening criteria to all CBCT images taken within the Ohio State University College of Dentistry from 2009 to June 2016. Inclusion criteria for the control group were males of at least 18 years of age, no known diagnosis of OSA, and full-head CBCT images taken in the closed mouth anatomic position (not supine). Exclusion criteria for both groups included missing maxillary canines or first molars, or pathology/artifacts in the area of interest. The Institutional Review Board at The Ohio State University approved the study protocol (protocol #2016H0008).
All CBCT scans were taken using an i-CAT Next Generation Platinum CBCT unit (Imaging Sciences International, Hatfield, Pennsylvania). At the time of image acquisition, no instructions were given to patents regarding tongue position or breathing. The only instructions given were to remain still and breathe through the nose while holding the teeth together gently. All Digital Imaging and Communications in Medicine files were imported into an imaging analysis program (Dolphin Imaging, version 11.9 Premium; Dolphin Imaging and Management Solutions, Chatsworth, California) for this study. Once imported, the three-dimensional images were all standardized in orientation consistent with a method used by Pliska et al.12 The midsagittal plane was determined from the skeletal midline using a line connecting nasion to opisthion. Coronal plane was determined to be perpendicular to Frankfort horizontal. The axial plane was determined by a line connecting the inferior borders of the left and right orbit parallel to the horizontal grid.
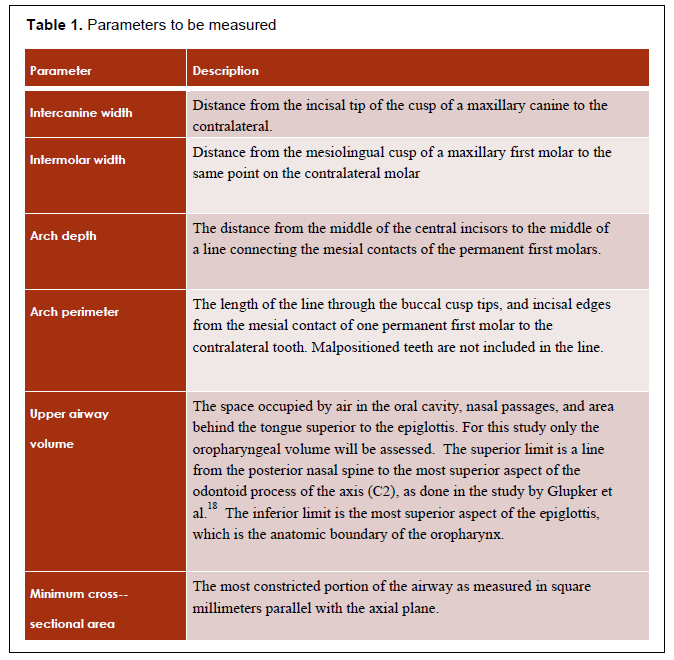
Each measurement was performed by a single blinded rater. Prior to study initiation a sample of 10 images were measured. After 2 weeks the same images were remeasured to calculate reliability of the measurement method. Measurement parameters and their description can be found in Table 1.
Airway volume and minimum axial area were calculated using the sinus/airway tool in the imaging software.17 The boundaries for oropharyngeal volume are consistent with those used in a study by Glupker et al.18 The superior boundary is defined by a line connecting the posterior nasal spine anteriorly and the most superior aspect of the odontoid process of the axis (C2) posteriorly. The inferior limit of the oropharyngeal volume is a line at the tip of the epiglottis extending anteriorly and posteriorly parallel with the horizontal axis. A threshold method was used to segment the airway. The airway sensitivity tool was adjusted to eliminate imaging artifacts and ranged from 50 to 75. Airway volume was calculated in cubic millimeters and the minimum axial area in square millimeters.
Isolation of the three-dimensional maxillary arch was done by using the software ‘Clipping Slice’ tool to remove all structures below the occlusal plane. The software ‘Digitize/Measure’ tool with the two-dimensional line tab selected was used to measure the maxillary arch parameters. The intercanine width was measured from the cusp tip of one maxillary canine to the contralateral side. The mesiolingual cusp tip of the maxillary first molar was used for intermolar width. The arch length was found by first drawing a line connecting the mesial contact points of the maxillary first molars. The midline point of this line was connected to a point on the same plane at the most facial portion of the maxillary incisor. Arch perimeter was found by measuring from the mesial contact point of the first molar to its antimere as measured through the contact points of posterior teeth and incisal edges of anterior teeth, ignoring those teeth that were malpositioned or blocked out so that the measurement represents an ideal arch form.
Reliability is assessed using intraclass correlation coefficients. Parameter means in each group are compared for significant difference using a stepdown Bonferroni-Holm analysis to account for multiple comparisons. Several parameters are assessed for predictive value via a receiver operating characteristic curve. Using the results from this study a difference of 10 mm2 minimum cross-sectional area can be determined with a power of 0.85.
RESULTS
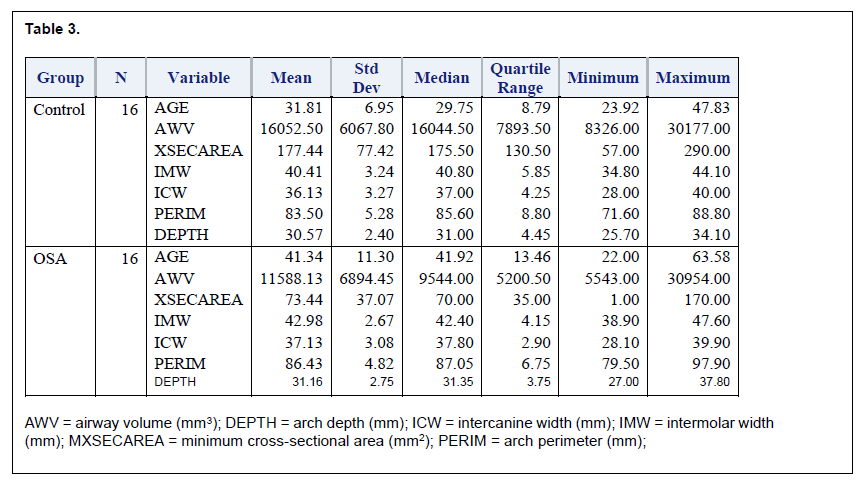
Twenty-one of the estimated 40 CBCT acquisitions had been completed at the time of analysis. Five of the subjects did not meet initial inclusion criteria and thus the final number of subjects in the OSA group was 16. Thirty-seven control patients met initial inclusion criteria. Of these, 16 were randomly selected to best match the OSA group for age. The OSA group had an average age of 41.3 (±6.9) years, as compared to 31.8 (±11.3) years in the control group. This age difference was found to be significantly different (P = 0.0097).
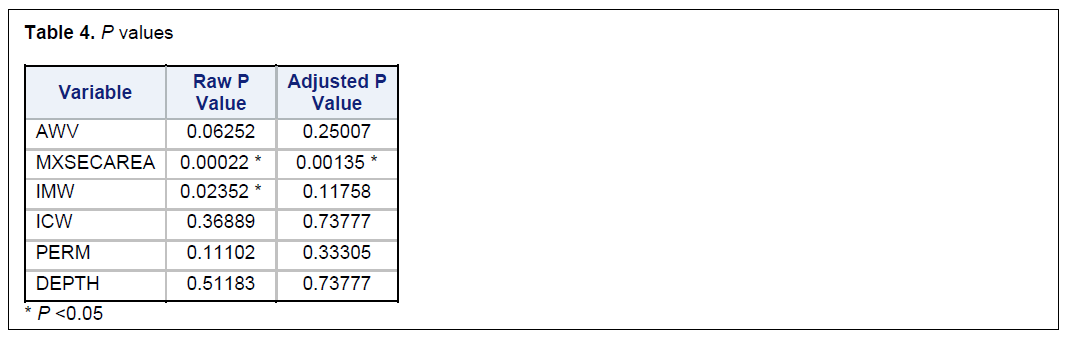
Intraclass correlation coefficients (Table 2) showed high reliability for all measurements (r = 0.8-1.0). Descriptive statistics for both the OSA and control groups are presented in Table 3. The control group had a larger airway volume (16052.5 ± 6067.8 mm3) than the OSA group (11588.1 ± 6894.5 mm3) but this difference was not statistically significant (Table 4). There were no significant differences between the groups in intercanine width, intermolar width, and arch perimeter or depth (P = 0.7377, 0.3331, 0.7378, respectively). Each of these parameters was slightly larger in the OSA group. Intermolar width was significantly different with a raw value of P (P = 0.0235) but not significant when adjusting for multiple comparisons (P = 0.1176).
Minimum cross-sectional area was the only parameter statistically different between groups. The control group mean minimum cross-sectional area (177.4 ± 77.4 mm2) was significantly larger (P = 0.00022) than the OSA group (73.4 ± 73.1 mm2). This difference remained statistically significant after accounting for multiple comparisons (P = 0.00135).
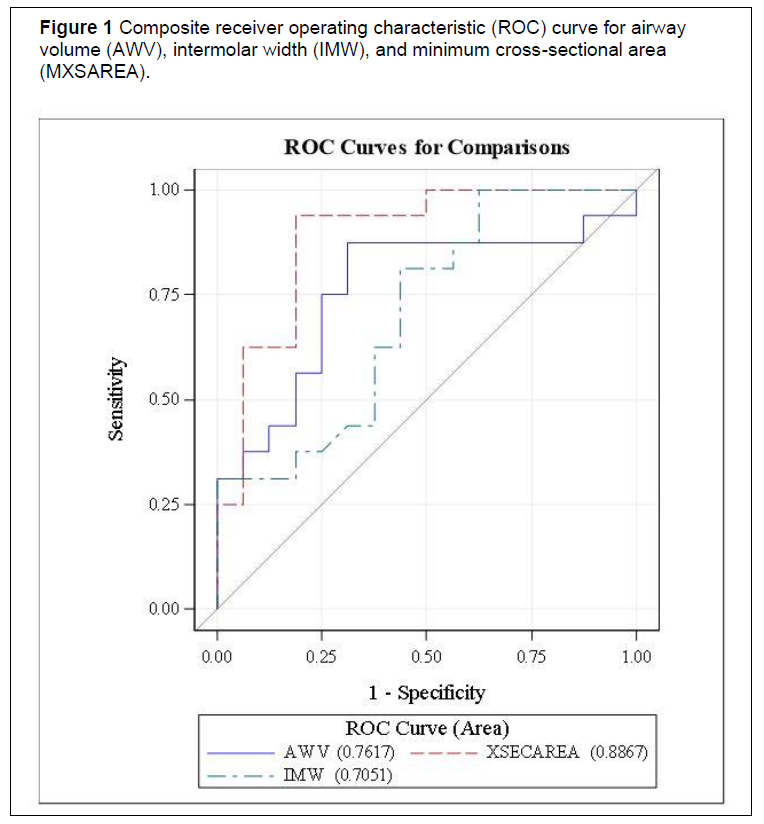
Airway volume, intermolar width, and minimum cross-sectional area were examined further using logistic procedures and receiver operating characteristic curves developed to assess predictive value for each parameter (Figure 1). Airway volume had an area under the curve (AUC) of 0.7617, indicating that it is a fair predictor for OSA. Intermolar width AUC was 0.7051, indicating a poor to fair predictor. Minimum cross-sectional area was a good to excellent predictor of OSA (AUC= 0.8867).
With minimum cross-sectional area being a good to excellent predictor a cut point determination was completed. This was the value at which the mean value of sensitivity plus specificity was highest. A cut-point of 111 mm2 was found. Based on our model the positive predictive value is 0.842, and the negative predictive value of 0.941 with an overall accuracy of 0.889. Therefore, if a patient’s minimum cross-sectional area is found to be below the cut-point there is an 84.2% chance they truly have OSA. If the minimum cross-sectional area is measured to be above the cut-point there is a 94.1% chance they do not have OSA.
Table 1Parameters to be measured |
Table 2Reliability of each measurement parameter |
Table 3 |
Table 4P values |
Figure 1Composite receiver operating characteristic (ROC) curve for airway |
|
DISCUSSION
The current study compared several dental and oral parameters from CBCT images that describe the size of the oral cavity and oropharyngeal airway in a group of African-American males with a diagnosis of OSA with a healthy control group. To the best of the authors’ knowledge this is the first study to compare an African-American OSA group to a control group. In addition, no study has compared maxillary arch parameters and airway with CBCT between an OSA and a control group. Previous studies evaluating extraction or expansion and airway size have been completed on patients without OSA.11-15,19,20
In the current study there was no difference between groups in maxillary intermolar width, intercanine width, arch depth, arch perimeter, or oropharyngeal airway volume. These findings contradict those of Seto et al4 who found significant differences in intercanine width, intermolar width, or maxillary arch depth. The OSA group had smaller dimensions in all three parameters. These findings also contradict those by Wang13 and Germec-Cakan et al14 who reported that tooth extraction and orthodontic therapy reduce arch depth and led to decreased pharyngeal volume. However, these authors did not investigate whether this decrease led to a higher AHI or increased prevalence of OSA. The results of this study are that arch depth is not different between an OSA and a control group. Valiathan et al11 and Pliska et al12 found no changes in oropharyngeal volume with orthodontic extraction treatment. These results are consistent with the results of the current study conducted with non-growing adults.
Minimum cross-sectional area was significantly different between the two groups. This result is consistent with the findings by Ogawa et al21 who investigated cross-sectional airway in patients with OSA. Ogawa et al also reported that the minimum cross-sectional area was significantly smaller in the OSA group (OSA: 45.8±17.5 mm2; non-OSA: 146.9 ± 111.7 mm2 [P = .011]). The study findings are also supported by Shigeta et al who found that the airway area/square area at the level of the inferior border of the C2 vertebra was 8.8% smaller in patients with OSA as compared to control patients without apnea.22 The minimum cross sectional area had good-excellent predictive value. A cut-point determination was found at 111 mm2. Another cut-point for minimum cross-sectional area could not be found in the current literature. Further studies are required to determine whether minimum airway cross-sectional area is a useful screening tool when reviewing CBCT images.
Initial screening for OSA should begin with a detailed health history including questions about signs and symptoms of the condition such as daytime fatigue, snoring, and witnessed apneas. It should include validated questionnaires where indicated and a thorough clinical examination. If the results of these steps indicate a high probability of OSA, the clinician might consider a CBCT as an additional measure. In this case, or if a CBCT was performed for other reasons, application of this cut-off number for cross-sectional area in African-American males might provide significant further evidence of a high risk for OSA.
One limitation was the small sample size in this study. Routine CBCT scans are not the standard of care and thus having a sample from an OSA population is difficult to obtain. Only two other studies have compared an OSA group to a control group with CBCT analysis.21, 22 Total number of patients for the OSA and control groups was 20 and 29 respectively (10 OSA, 10 non-OSA21; 15 OSA, 14 non-OSA22) which is comparable to the current study. Future studies with larger sample sizes are needed.
The OSA group had a mean age that is 10 years older than that of the control patients (41.3 ±6.9 years, as compared to 31.8 ±11.3 years) and is statistically significant (P = 0.0097). It is known that the prevalence of OSA increases with age.23 This increase is hypothesized to be due to an increase in body mass index and decrease in muscle tone with age. Dúran et al reported that the prevalence of OSA increases with an odds ratio of 2.2 for every 10-year increase in age for men and women.24 Several other studies have investigated the prevalence of OSA with age. Young et al25 presented age-specific estimates of sleep-disordered breathing in the general population. They estimate that 17% of males age 30 to 39 years would have an AHI ≥ 5. For this same age group Dúran found the estimate to be 9%. In males age 40 to 49 years, the percentage was 25.6%. For an AHI ≥10 those age 30 to 39 years the percentage was 12% versus 18% in those age 40 to 49 years. Dúran reported 7.6 vs 18.2% respectively. These data show a greater percentage of males in the fifth decade of life have OSA than do those in the fourth decade of life. The control sample in the current study was not tested by a sleep study but these data suggest they are less likely to be affected.
Maxillary dental and oral parameters were not associated with a higher risk of OSA in African-American males and are not predictive of risk for OSA. A decreased minimum cross-sectional area was associated with OSA in African-American males and has the potential as a screening tool when a CBCT image is available. Because of small sample size these data need to be corroborated by larger studies.
CONCLUSION
- CBCT is a reliable tool for assessing airway and dental arch parameters.
- There are no differences in arch width, depth, or perimeter in African-American adult males with OSA and control patients.
- Minimum cross-sectional area appears to be a useful screening tool for OSA.
- According to the current study a cut-point of 111 mm2 is a good-to-excellent predictor with high positive and negative predictive value for OSA.
- Due to small sample size and insufficient controls these data need to be corroborated by larger studies.
ACKNOWLEDGMENTS
We thank Dr. J. Martin Palomo and Case Western Reserve University, Department of Orthodontics for providing deidentified control images. We would like to thank the Delta Dental Foundation for their financial support.
REFERENCES
- Young T, Peppard PE, Gottlieb DJ. Epidemiology of obstructive sleep apnea: a population health perspective. Am J Respir Crit Care Med. 2002;165:1217–1239
- Peppard PE, Young T, Barnet JH, Palta M, Hagen EW, Hla KM. Increased prevalence of sleep-disordered breathing in adults. Am J Epidemiol. 2013;177(9):1006-1014.
- Lavie L. Oxidative stress in obstructive sleep apnea and intermittent hypoxia-revisited- The bad ugly and good: Implications to the heart and brain. Sleep Med Rev. 2015;20: 27e45
- Seto BH, Gotsopoulos H, Sims MR, Cistulli PA. Maxillary morphology in obstructive sleep apnoea syndrome. Eur J Orthod. 2001;23(6):703-714.
- Young T, Skatrud J, Peppard PE. Risk factors for obstructive sleep apnea in adults. JAMA. 2004;291(16):2013-2016. doi:10.1001/jama.291.16.2013.
- Meyer Jr JB, Knudson RC. The sleep apnea syndrome. Part I: Diagnosis. J Prosthet Dent. 1989;62(6):675–679.
- Ghoneima A, Kula K. Accuracy and reliability of cone-beam computed tomography for airway volume analysis. Eur J Orthod. 2013;35:256–261. doi:10.1093/ejo/cjr099.
- Hatcher DC: Operational principles for cone-beam computed tomography. J Am Dent Assoc. 2010;141(Suppl 3):3S–6S.
- Lenza MG, Lenza MM, Dalstra M, Melson B, Cattaneo PM. An analysis of different approaches to the assessment of upper airway morphology: a CBCT study. Orthod Craniofac Res. 2010;13:96-105.
- Katsantonis G, Moss K, Miyazaki S, Walsh J. Determining the site of airway collapse in obstructive sleep apnea with airway pressure monitoring. Laryngoscope 1993;103 (10):1126.
- Valiathan M, El H, Hans MG, Palomo M. Effects of extraction versus non-extraction treatment on oropharyngeal volume. Angle Orthodontist.(2010;80(6):1068-1074.
- Pliska BT, Tam IT, Lowe AA, Madson AM, Almeida FR. Effect of orthodontic treatment on the upper airway volume in adults. Am J Orthod Dentofacial Orthop. 2016;150(6):937-944.
- Wang Q, Iia P, Anderson NK, Wang L, Lin J. Changes of pharyngeal airway size and hyoid bone position following orthodontic treatment of Class I bimaxillary protrusion. Angle Orthod. 2012;82:115–121.
- Germec-Cakan D, Taner T, Akan S. Uvulo-glossopharyngeal dimensions in non-extraction, extraction with minimum anchorage, and extraction with maximum anchorage. Eur J Orthod. 2011;33(5):515-520.
- Sutherland K, Lee R, Cistulli P. Obesity and craniofacial structure as risk factors for obstructive sleep apnoea: Impact of ethnicity. Respirology. 2012;17(2)213-222.
- Redline S, Tishler PV, Hans MG. Racial differences in sleep disordered breathing in African-Americans and Caucasians. Am J Respir Crit Care Med. 1997;155:186-192.
- EL H, Palomo JM. Measuring the airway in 3 dimensions: a reliability and accuracy study. Am J Orthod Dentofacial Orthop. 2010;137(4 Suppl):S50.e1-9.
- Glupker L, Kula K, Parks E, Babler W, Steward K, Ghoneima A. Three-dimensional computed tomography analysis of airway volume changes between open and closed jaw positions. Am J Orthod Dentofacial Orthop. 2015;147(4):426-434.
- Stefanovic N, El H, Chenin DL, Glisic B, Palomo JM. Three-dimensional pharyngeal airway changes in orthodontic patients treated with and without extractions. Orthod Craniofac Res. 2013;16:87-96.
- Zhao Y, Nguyen M, Gohl E, Mah J, Sameshima G, Enciso R. Oropharyngeal airway changes after rapid palatal expansion evaluated with cone-beam computed tomography. Am J Orthod Dentofacial Orthop. 2010;137(4 Suppl):S71-78.
- Ogawa T, Enciso R, Shintaku W, Clark GT. Evaluation of cross-section airway configuration of obstructive sleep apnea. Oral Surg Oral Med Oral Pathol Oral Radiol Endod. 2007;103(1):102-108. doi:10.1016/j.tripleo.2006.06.008.
- Shigeta Y, Enciso R, Ogawa T, Shintaku W, Clark G. Correlation between retroglossal airway size and body mass index in OSA and non-OSA patients using cone bean CT imaging. Sleep Breath. 2008;12:347. doi:10.1007/s11325-008-0186-6.
- Bixler E, Vgontzas A, Ten Have T, Tyson K, Kales A. Effects of age on sleep apnea in men: I. Prevalence and severity. Am J Respir Crit Care Med. 1998;157(1):144-148.
- Durán J, Esnaola S, Rubio R, Iztueta A. Obstructive sleep apnea-hypopnea and related clinical features in a population-based sample of subjects aged 30 to 70 yr. Am J Respir Crit Care Med. 2001;163(3 Pt 1):685-689.
- Young T, Palta M, Dempsey J, Skatrud J, Weber S, Badr S. The occurrence of sleep-disordered breathing among middle-aged adults. N Engl J Med. 1993;328:1230-1235.
SUBMISSION & CORRESPONDENCE INFORMATION
Submitted May 15, 2020
Submitted in final revised form October 3, 2020
Accepted for publication March 14, 2021
Address correspondence to: Dr. Allen Firestone, College of Dentistry, Room 4088 Postle Hall, 305 W 12th Ave, Columbus, OH 43210l Email: firestone.17@osu.edu