Original Article 1, Issue 13.1
Using a Wearable’s Multi-Night Capability to Mitigate Night-to-Night Variability in a Dental Clinic Cohort
http://dx.doi.org/10.15331/jdsm.7416Chih-Wei Tsai, PhD1; Juan Martin Palomo, DDS, MSD2; Brittany Link, DMD, MSD3; Pai-Lien Chen, PhD4; Cynthia Cheung, PhD1; Lydia Leung, PhD1; Ambrose A. Chiang, MD5-7
1Belun Technology Company Limited, Hong Kong; 2Department of Orthodontics, School of Dental Medicine, Case Western Reserve University, Cleveland, OH; 3Alpan Orthodontics, Los Angeles, CA; 4FHI360, Durham, NC; 5Department of Medicine, Case Western Reserve University, Cleveland, OH; 6Division of Sleep Medicine, Louis Strokes Clevland VA Medical Center, Cleveland, OH; 7Division of Pulmonary, Critical Care, and Sleep Medicine, University Hospitals Cleveland Medical Center, Cleveland, OH
ABSTRACT
Study Objectives:
A major limitation of the conventional obstructive sleep apnea (OSA) testing methods is their reliance on single-night study, which may exhibit misdiagnosis or severity miscategorization because of night-to-night variability. Although novel wearables facilitate multinight monitoring, the optimal nights required for enhancing OSA diagnostic performance remains uncertain. This study explores how the Belun Ring (BR) multinight capability can attenuate night-to-night variability in individuals with no or mild OSA.
Methods:
Participants from a university orthodontic clinic underwent multinight BR testing. Apnea-hypopnea index-4% (AHI4%) and oxygen desaturation index-3% (ODI3%) were recorded. Multi-night averages of all available nights served as the reference standards. Diagnostic performance was assessed using F1 score, area under the receiver operating characteristic curve, and concordance correlation coefficient. Bootstrapping simulations were conducted for N-night AHI4% and ODI3% diagnostic reliability.
Results:
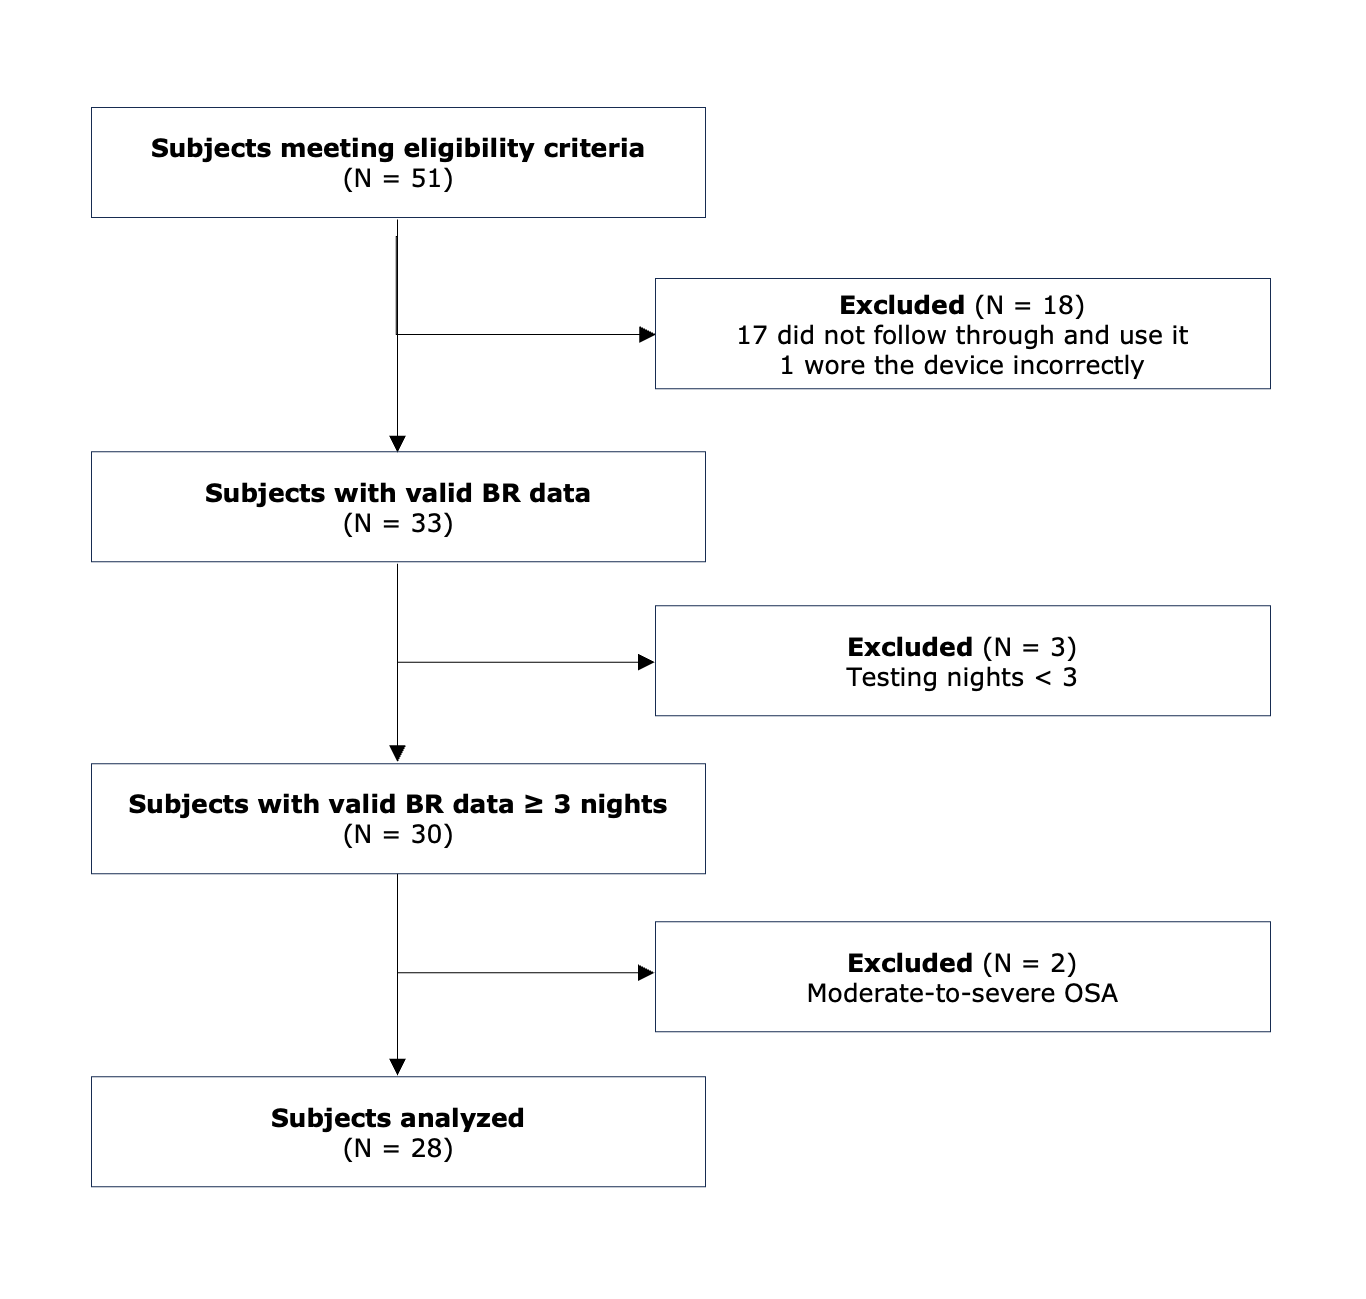
Twenty-eight patients (mean age 33.4 years, 75% female, body mass index 24.6) completed ≥3 nights of BR testing with ≥60 min/night total sleep time. A 2-night AHI4% average achieved a F1 score of 0.90 and area under the receiver operating characteristic curve of 0.93, with performance gains plateauing on the third night. Agreement analysis showed strong concordance (concordance correlation coefficient) 0.95 for AHI4%, 0.96 for ODI3% with 2-night testing. Bootstrapping simulation confirmed that BR testing for 3 nights reduces night-to-night variability and enhances diagnostic reliability.
Conclusion:
Compared to single-night sleep testing, BR for 3 nights can reduce night-to-night variability in individuals with no or mild OSA.
Clinical Implications:
Multi-night wearable testing can mitigate the effect of night-to-night variability, thereby improving the reliability of OSA diagnosis.
Keywords:
Obstructive sleep apnea (OSA), home sleep apnea testing (HSAT), apnea-hypopnea index (AHI), oxygen desaturation index (ODI), wearable, sleep technology, night-to-night variability, dental sleep medicine
Citation:
Tsai CW, Palomo JM, Link B, et al. Using a Wearable’s Multi-Night Capability to Mitigate Night-to-Night Variability in a Dental Clinic Cohort. J Dent Sleep Med. 2026;13(1)
INTRODUCTION
Obstructive sleep apnea (OSA) is highly pervasive across different populations, with its prevalence varying based on demographic and clinical characteristics in the general population. OSA, defined by an apnea-hypopnea index (AHI) ≥5 events/h, affects approximately 9% to 38% of adults.1 The prevalence increases with age, reaching up to 90% in elderly men and 78% in elderly women.2 The Wisconsin Sleep Cohort reported that 7.6% of women and 15.6% of men aged 30 to 60 years had mild OSA (PSG-AHI 5–15 events/h).3 A follow-up study using the same criteria found that 21.4% of adults aged 30 to 70 years had mild OSA.4 Although the long-term neurocognitive and cardiovascular effects of mild OSA remain uncertain, emerging evidence suggests that treatment may at least benefit symptomatic individuals by improving daytime function and overall quality of life.5
The conventional OSA diagnostic approaches typically rely on single-night testing, utilizing either in-laboratory polysomnography (PSG) or home sleep apnea testing (HSAT).6–8 However, the reliability of single-night sleep apnea assessments has been increasingly questioned due to significant night-to-night variability in AHI, which may lead to OSA severity misclassification or misdiagnosis.9–11 This variability is influenced by multiple factors, including night-to-night variation of body or head position, REM percentage, nonanatomic OSA endotypes (for example, arousal threshold, loop gain and upper airway muscle responsiveness), nasal resistance, medications (particularly benzodiazepines and opioids), alcohol consumption, and behavioral factors such as physical activity or caffeine consumption.12–18 Variability in the amount of time spent in REM versus NREM sleep is known to affect AHI.19 Positional influences are well documented, with increased supine sleep and head flexion associated with higher AHI, whereas head rotation and lateral head positioning appear to reduce OSA severity.16,20 Additionally, clinical factors, including overnight rostral fluid shift in patients with heart failure, sleep fragmentation, and coexisting insomnia, may also contribute to increased AHI variability.14,15,21–23
Both the in-laboratory PSG and flow-based HSAT have demonstrated night-to-night variability.9,10,24-26 Studies using in-laboratory PSG have reported weak correlations in AHI across consecutive nights, with 10% to 60% of participants exhibiting fluctuations of ≥5 or ≥10 events/h and 20% to 40% shifting between OSA severity categories.10,24–25 Similarly, a large-scale study involving 10,340 adults undergoing 3 nights of type 3 flow-based HSAT demonstrated that 20% of those with mild or moderate OSA on the first night were misdiagnosed or misclassified in severity when compared to the 3-night composite AHI.26 Another study assessing night-to-night variability using a peripheral arterial tonometry-based device over 3 consecutive nights identified substantial variability, with AHI fluctuating by more than 10 events/h between the nights in 35% of participants.20 Misclassification of OSA severity was noted in 24% of patients when a single-night AHI was compared to the average AHI. In addition, a meta-analysis encompassing 24 studies with 3,250 participants using PSG, respiratory polygraphy, or a validated HSAT device (including pulse oximetry) found that although the mean AHI difference between the first and second night was small (-1.7 events/h) at the group level, there is a remarkable intraindividual variability of respiratory parameters leading to high rates of missed OSA diagnosis and severity category changes from night to night. Notably, up to 41% of individuals exhibited AHI variations exceeding 10 events/h in either direction, with nearly half shifting OSA severity categories at least once in sequential sleep studies. Furthermore, up to 12% of patients would have been missed with a single-night sleep study, depending on the AHI cutoff used.9 These findings underscore the importance of multi-night home sleep testing for enhancing diagnostic reliability.
Since 2019, the US Food and Drug Administration (FDA) has cleared 12 wearable devices or software as a medical device (SaMD) for OSA diagnosis.27,28 In comparison with conventional flow-based HSATs that remain relatively “user-unfriendly" for multinight applications, novel sleep technologies generally offer greater ease of use, minimal setup requirements, automated signal processing and scoring, and a more streamlined user experience, which collectively facilitate multi-night data acquisition and longitudinal monitoring. This capability is particularly valuable for assessing the efficacy of various non-CPAP therapeutic modalities, including oral appliance therapy (OAT), nasal expiratory positive airway pressure (EPAP), negative intraoral pressure devices, or hypoglossal nerve stimulators.29,30 Although carrying great potential in clinical practice, the AHI night-to-night variability in these novel OSA diagnostic tools has not been extensively investigated.
The Belun Sleep System BLS-100, also known as Belun Ring (BR) (Belun Technology Company Limited, Hong Kong), is a medical-grade, photoplethysmography (PPG)-based, deep learning (DL)-powered OSA-detecting wearable (K222579).31 Its core hardware, the Belun Ring sensor, is an FDA-cleared reflectance pulse oximeter (K211407).32 The BR system uses advanced convolutional neural networks and transformer-based recurrent neural networks algorithms to detect respiratory events and classify sleep stages, and its diagnostic performance has been rigorously evaluated in a recent study.33 It was hypothesized that multi-night home testing using the BR device can mitigate the effect of night-to-night variability, thereby improving the reliability of OSA diagnosis. This study aims to investigate the AHI night-to-night variability measured by the BR and to evaluate how its multi-night testing capability can mitigate night-to-night variability in a cohort consisting of individuals with no OSA and mild OSA.
METHODS
Participants Recruitment
Adults aged 18 to 75 years were recruited from the Case Western Reserve University Orthodontics Clinic. Eligible participants were those currently receiving orthodontic treatment at the clinic, willing to provide informed consent, and able to complete the study protocol, including the return of the BR after multiple nights of testing. Individuals taking blood pressure medications or those who were pregnant or attempting to conceive were excluded from the study.
Multi-Night HSAT Using the BR
Participants were instructed to wear the BR on their nondominant index finger for up to 10 nights. The BR offers the AHI based on 4% oxygen desaturation (AHI4%, events/h), oxygen disturbance index based on 3% desaturation (oxygen desaturation index (ODI)3%, events/h), saturation of peripheral oxygen (SpO2) data, pulse rate, motion, total sleep time, sleep efficiency (%), sleep stages, REM sleep (%), wake count, sleep onset latency (minutes), wake after sleep onset (minutes), and extensive time- and frequency-domain pulse rate variability metrics.33,34
Statistical Analysis
Continuous variables were summarized as means with standard deviation (SD). Fisher exact test was used to compare sex distribution between the no OSA and mild OSA groups, whereas Mann-Whitney U rank tests assessed differences in age, body mass index, total sleep time, REM, AHI4%, and ODI3%. The mean values of multi-night sleep parameters (total sleep time, sleep efficiency, REM, wake count, sleep onset latency, wake after sleep onset, AHI4%, and ODI3%) across all available nights for each participant were calculated as reference standards. Differences between the first night and reference values were analyzed using paired t-tests, or the Wilcoxon signed-rank test if data were not normally distributed.
To evaluate multi-night testing performance, sensitivity, specificity, Cohen kappa coefficient, F1 score, and area under the receiver operating characteristic curve (AUC-ROC) for the N-night averaged AHI4% versus reference standard AHI4% (i.e, mean AHI4% across all available nights) were computed. Agreement between the N-night average and the reference AHI4% and ODI3% was assessed using the concordance correlation coefficient (CCC), and the Bland-Altman plots for AHI4% and ODI3% were generated to visualize individual differences between these values.
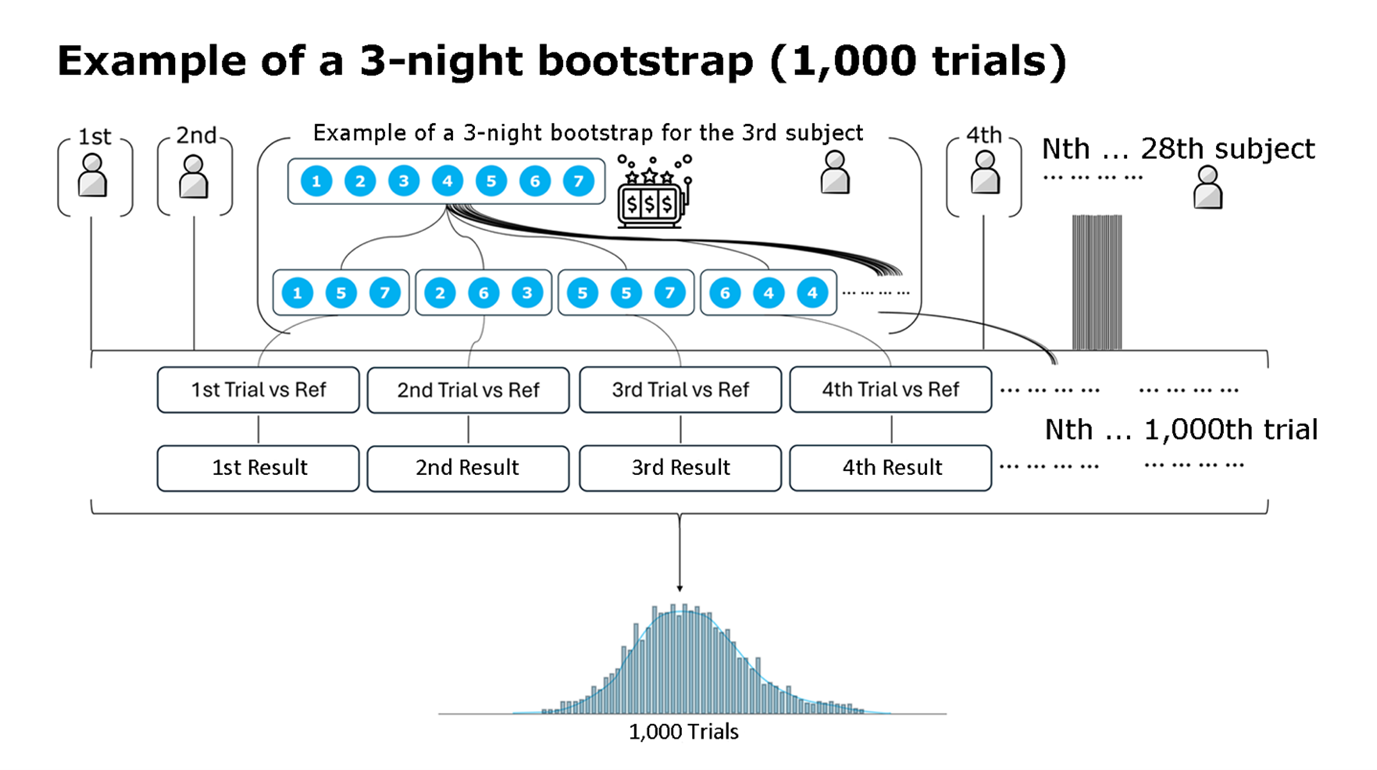
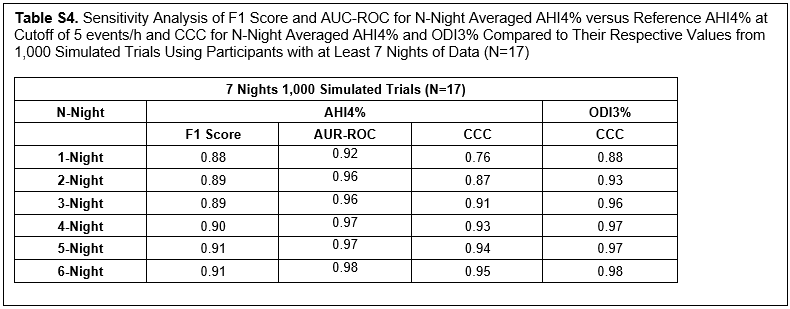
To date, research evaluating the night-to-night variability of novel OSA-detecting sleep technologies remains limited, with no standardized methodology or universally accepted metric thresholds established to assess the optimization of multi-night testing performance. A recent study has employed bootstrapping techniques to randomly resample selected nights within a defined period to capture within-subject night-to-night variability.35 To account for sample size limitations and quantify night-to-night variability, similar bootstrapping simulations were used, generating 1,000 resampled trials for each N-night average of AHI4% or ODI3%. In each trial, AHI4% and/or ODI3% values were randomly sampled for each participant to create a distribution of performance metrics (Figure S1). To assess the effect of excluding participants with fewer recorded nights on the stability of AHI4% performance and agreement metrics, a sensitivity analysis was conducted to validate the robustness of the bootstrapping results.
The study protocol was approved by the Case Western Reserve University Institutional Review Board (STUDY20221147) and registered at ClinicalTrials.org (NCT06900530).
RESULTS
Baseline Information
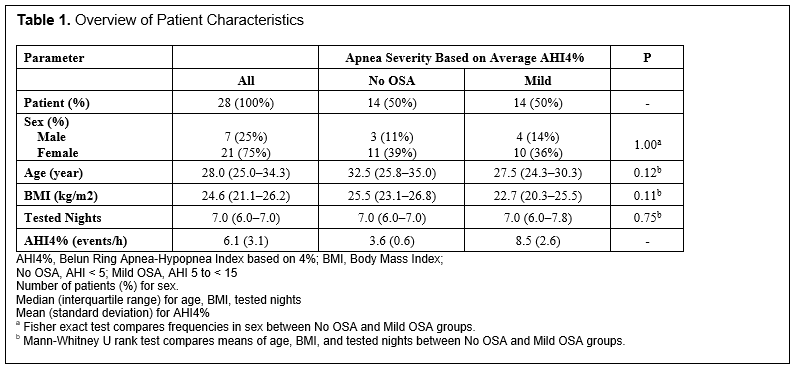
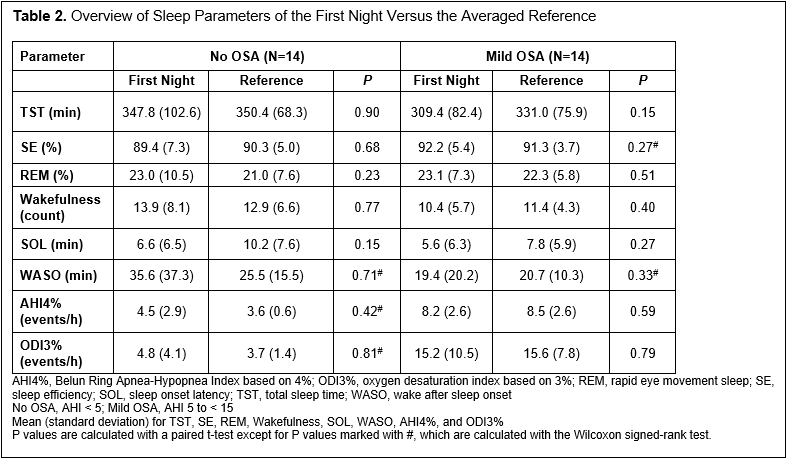
The median age (interquartile range, IQR) of the cohort was 28 years (25.0–34.3). Based on AHI4% values from the reference standard, 14 participants (50%) were classified as having no OSA, and mild OSA was diagnosed in an additional 14. No significant differences in sex ratio, age, or body mass index were observed between the no OSA and mild OSA groups. The mean (SD) AHI4% was 3.6 (0.6) in the no OSA group and 8.5 (2.6) in the mild OSA group. Comparisons between the first night and the reference values showed no significant differences in sleep parameters, including AHI4% and ODI3% (Table 2).
Multi-Night Performance Based on Actual Cohort Data
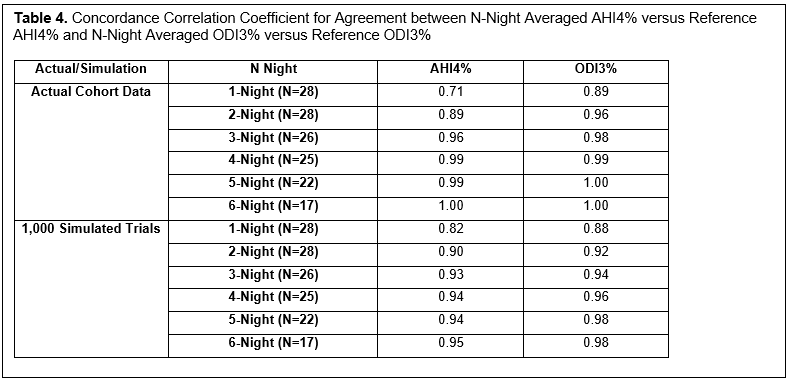
Agreement analysis showed a CCC of 0.71 for AHI4% and 0.89 for ODI3% on the first night (Table 4 and Figure 2). With 2-night data, CCC improved to 0.89 for AHI4% and 0.96 for ODI3%, whereas the 3-night average further increased CCC to 0.96 for AHI4% and 0.98 for ODI3%, after which performance remained stable (Table 4).
Multi-Night Performance Based on Bootstrapping Simulation Data
Figure 1. |
Table 1. Overview of Patient Characteristics |
Table 2. Overview of Sleep Parameters of the First Night Versus the Averaged Reference |
Table 3. Diagnostic Performance Metrics of N-Night Averaged AHI4% Versus the Reference AHI4% at Cutoff of 5 events/h
(more ...)
Table 4. Concordance Correlation Coefficient for Agreement between N-Night Averaged AHI4% versus Reference AHI4% and N-Night Averaged ODI3% versus Reference ODI3%
(more ...)
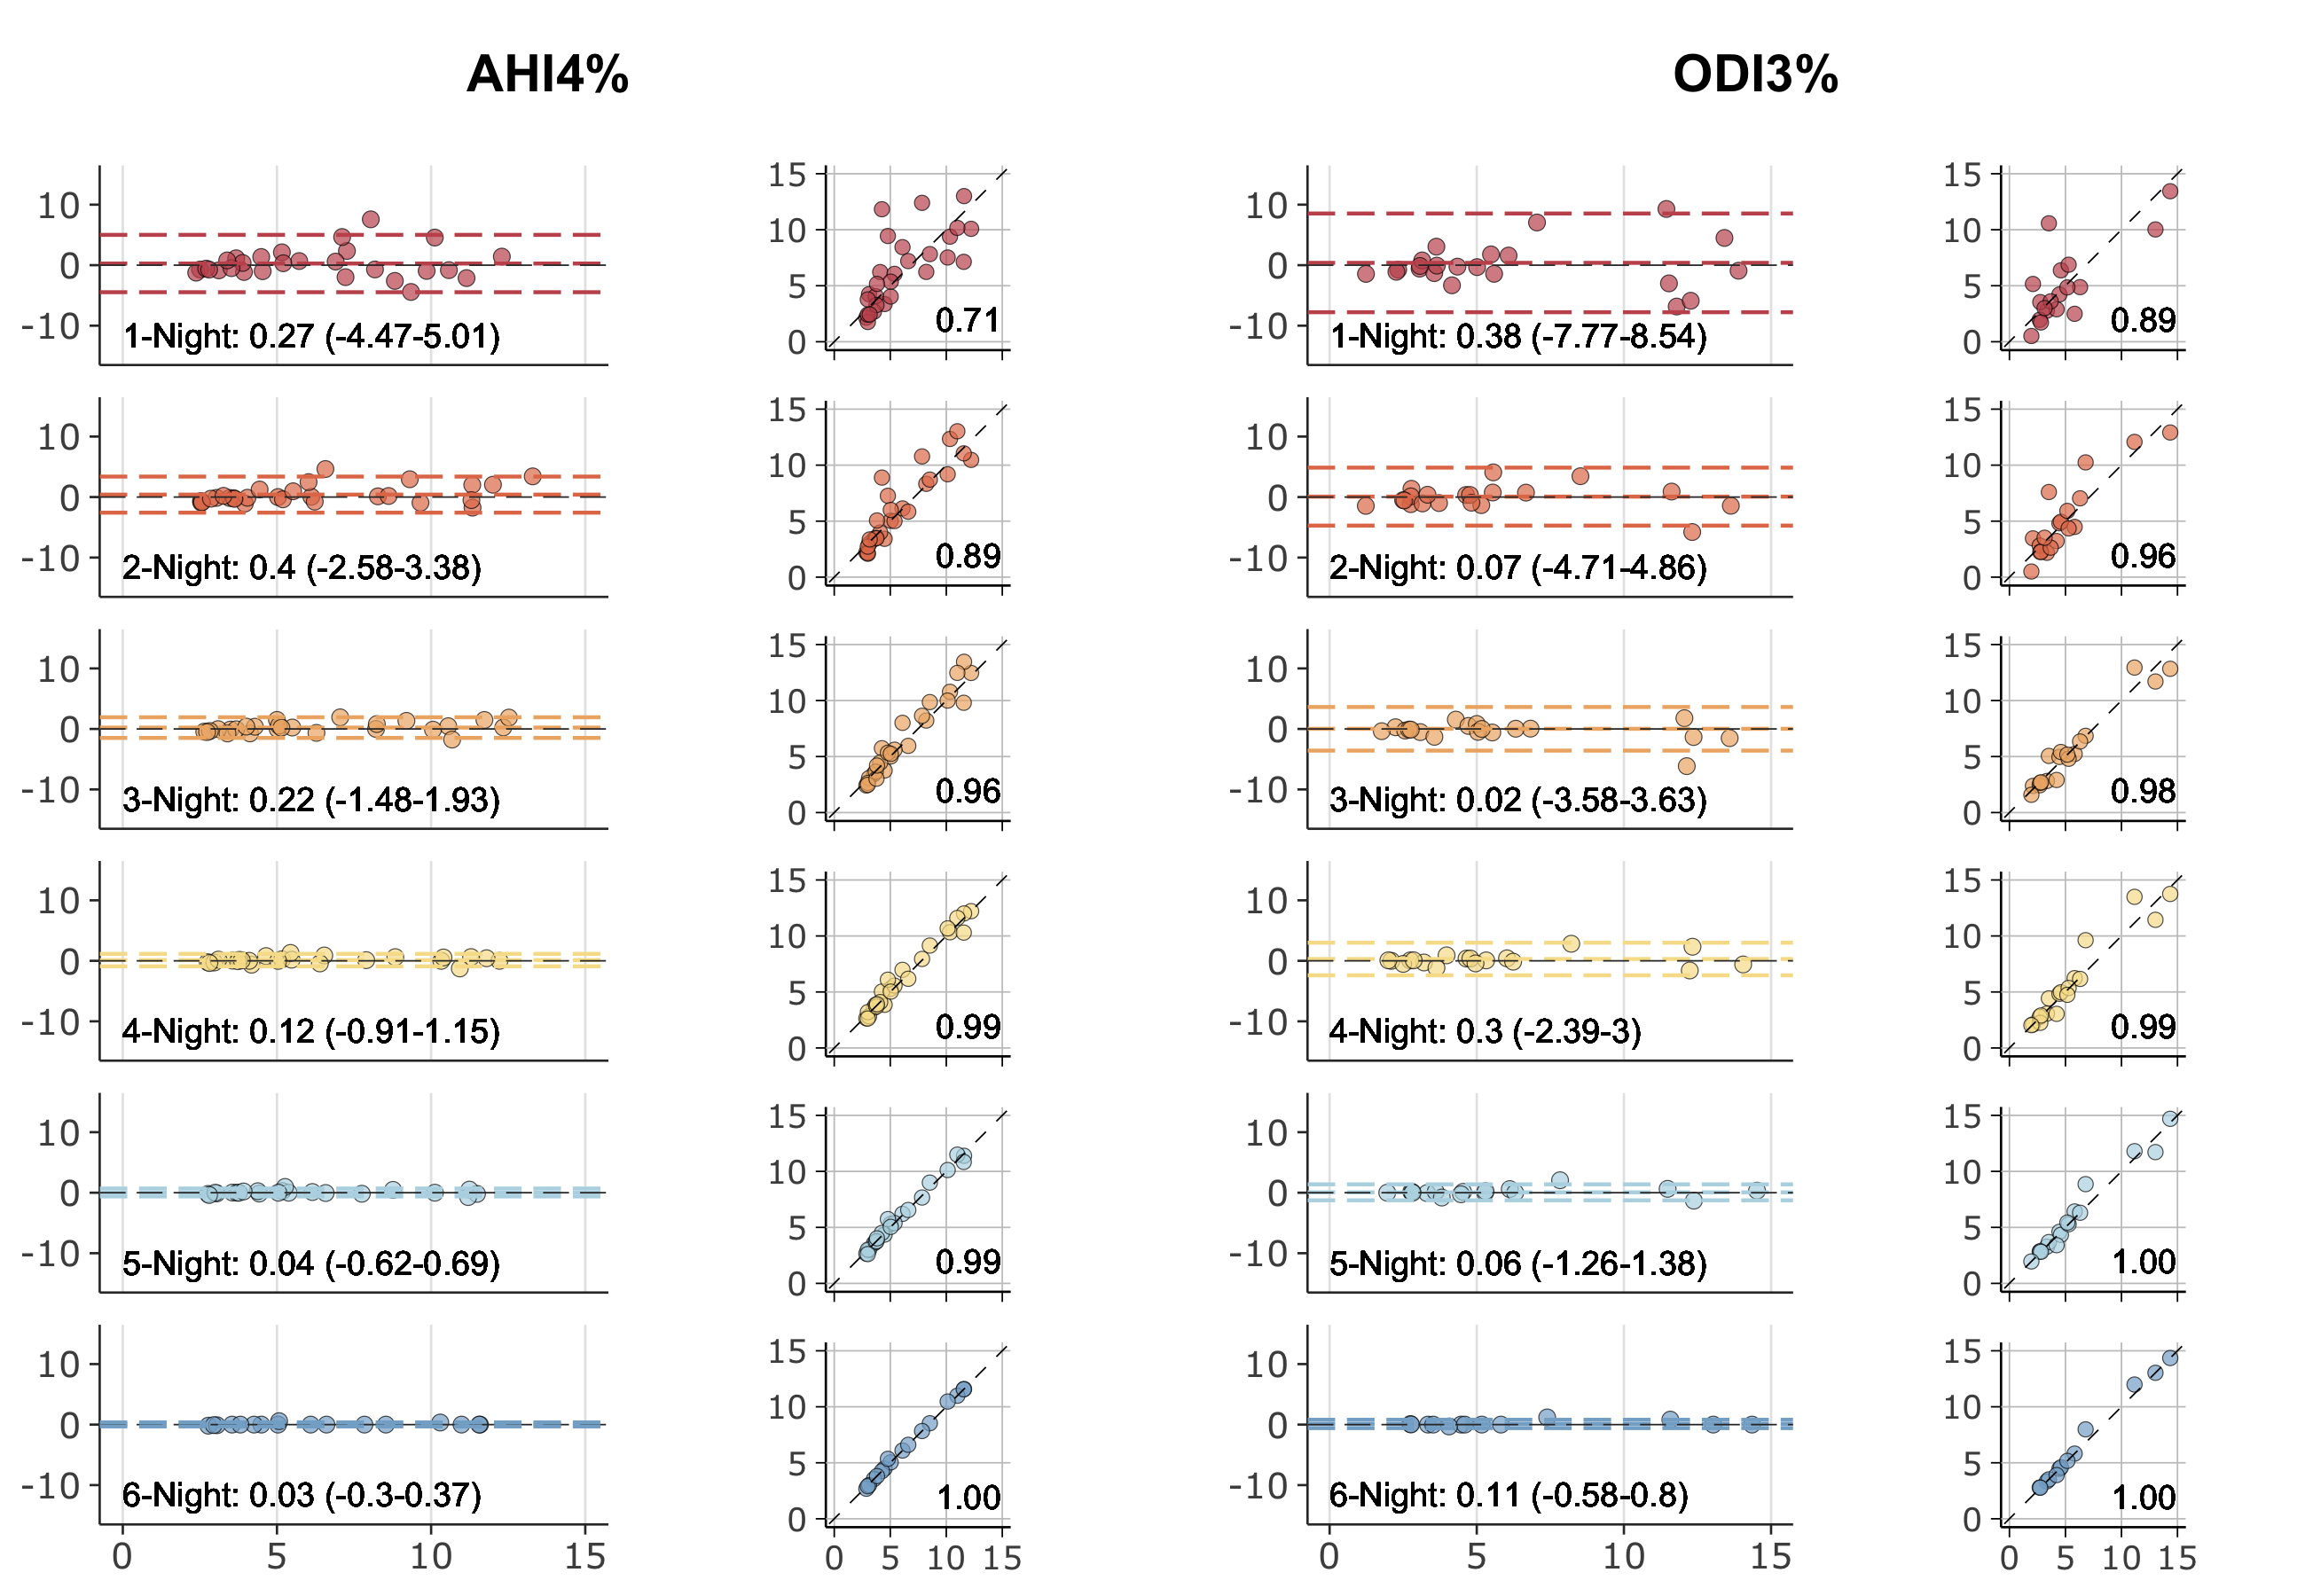
Figure 2. Bland-Altman and correlation plots illustrating agreement between N-night averaged and reference AHI4% (A) and between N-night averaged ODI3% and reference ODI3% (B).
Dashed lines in the Bland-Altman plots indicate the mean bias and the upper and lower limits of agreement (LoA, defined as ±1.96 standard deviation from the mean difference). Dashed lines in the correlation plots between N-Night averaged AHI4%/ODI3% and reference AHI4%/ODI3% represent perfect agreement. The numbers within the panels represent the concordance correlation coefficient (CCC) in correlation and bias and LoA in Bland-Altman plots.
(more ...)
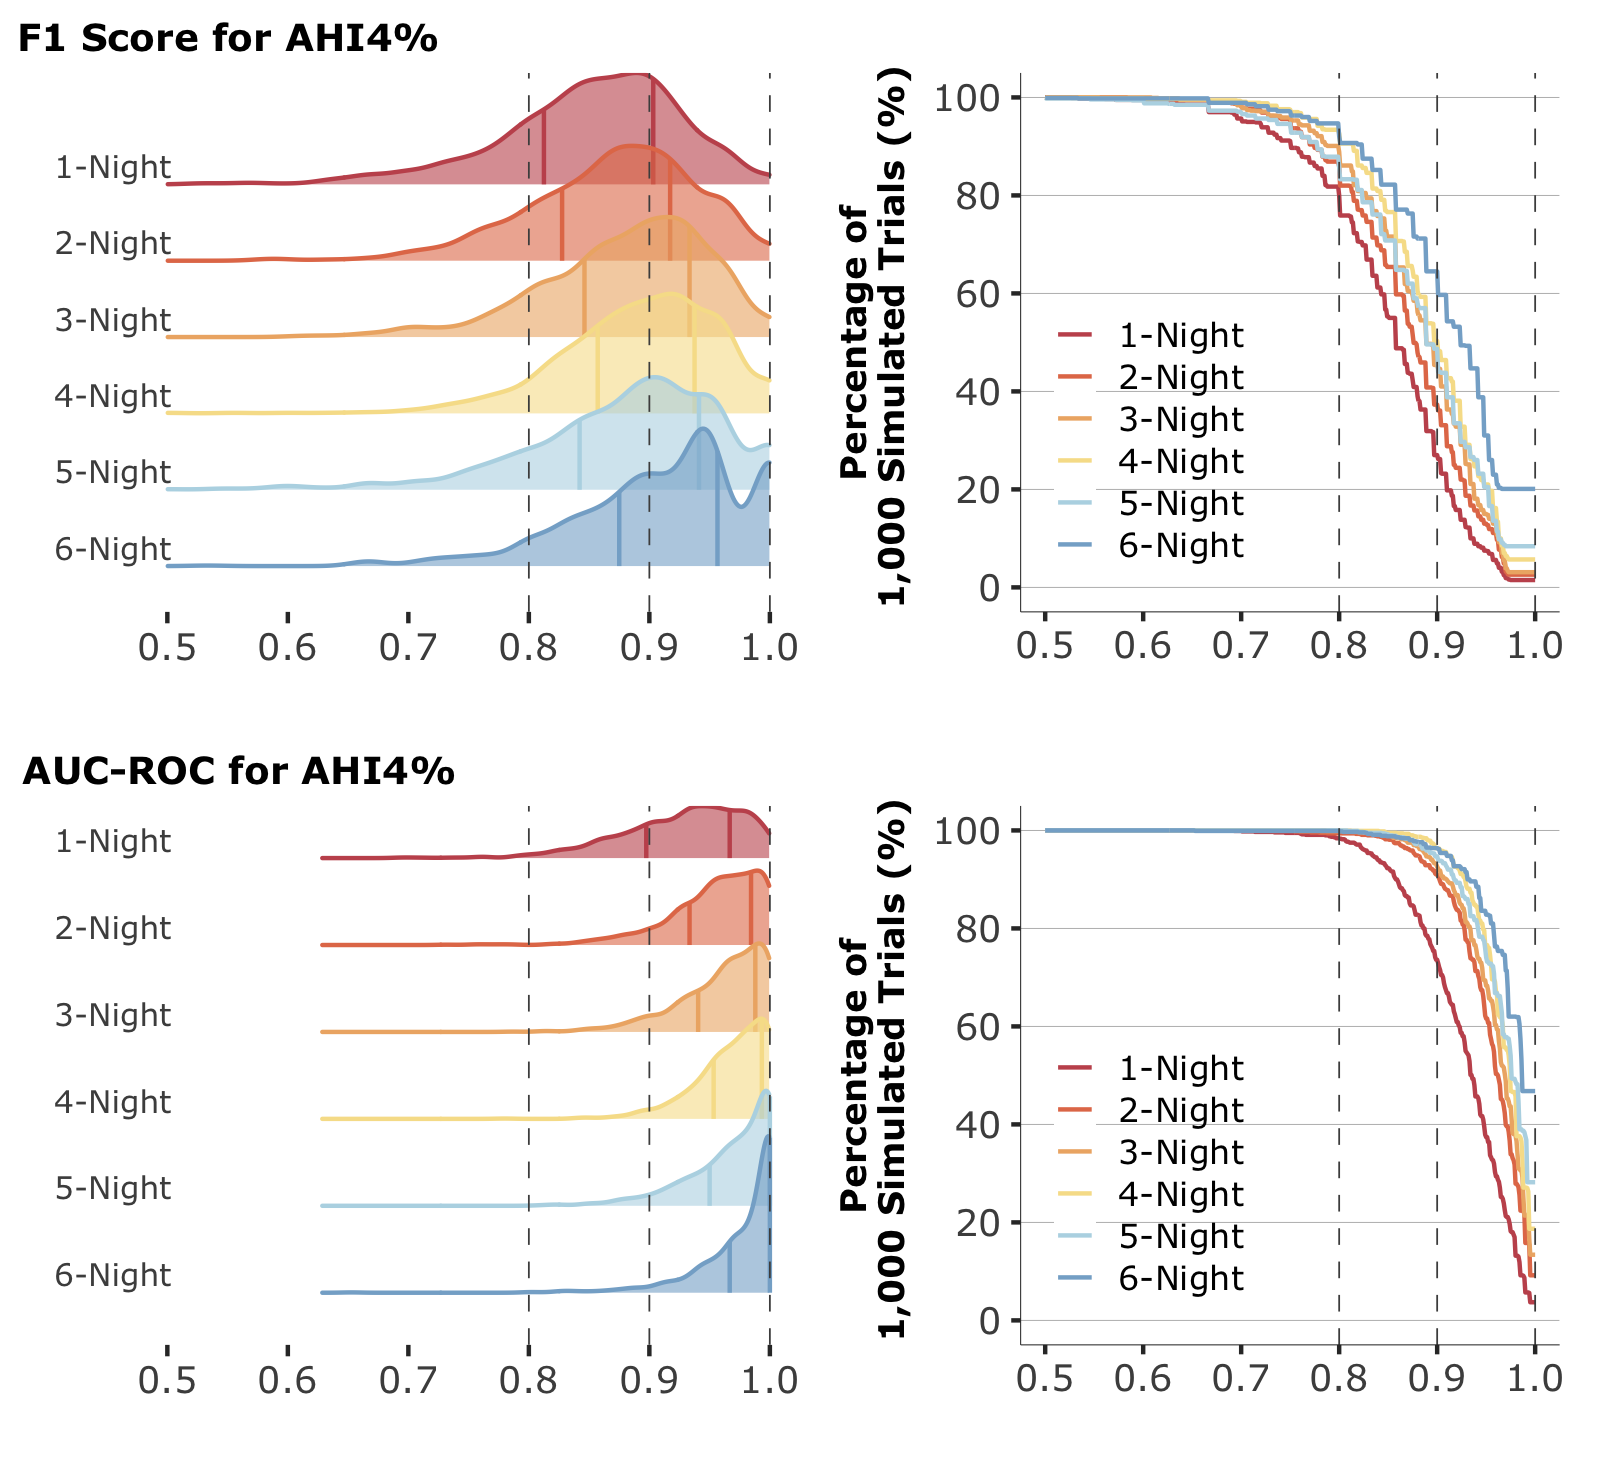
Figure 3. Distribution of F1 Score, area under the receiver operating characteristic curve (AUC-ROC), and percentage of simulations for AHI4% across N-night averages.
The plots display the distribution of F1 Score, AUC-ROC, and concordance correlation coefficient (CCC) values for AHI4% and CCC values for ODI3% from 1,000 simulated trials comparing N-night averaged with reference values. The solid vertical lines represent the interquartile range (25th to 75th percentile). The accompanying graphs show the percentage of 1,000 simulated trials corresponding to values across N-night data.
(more ...)
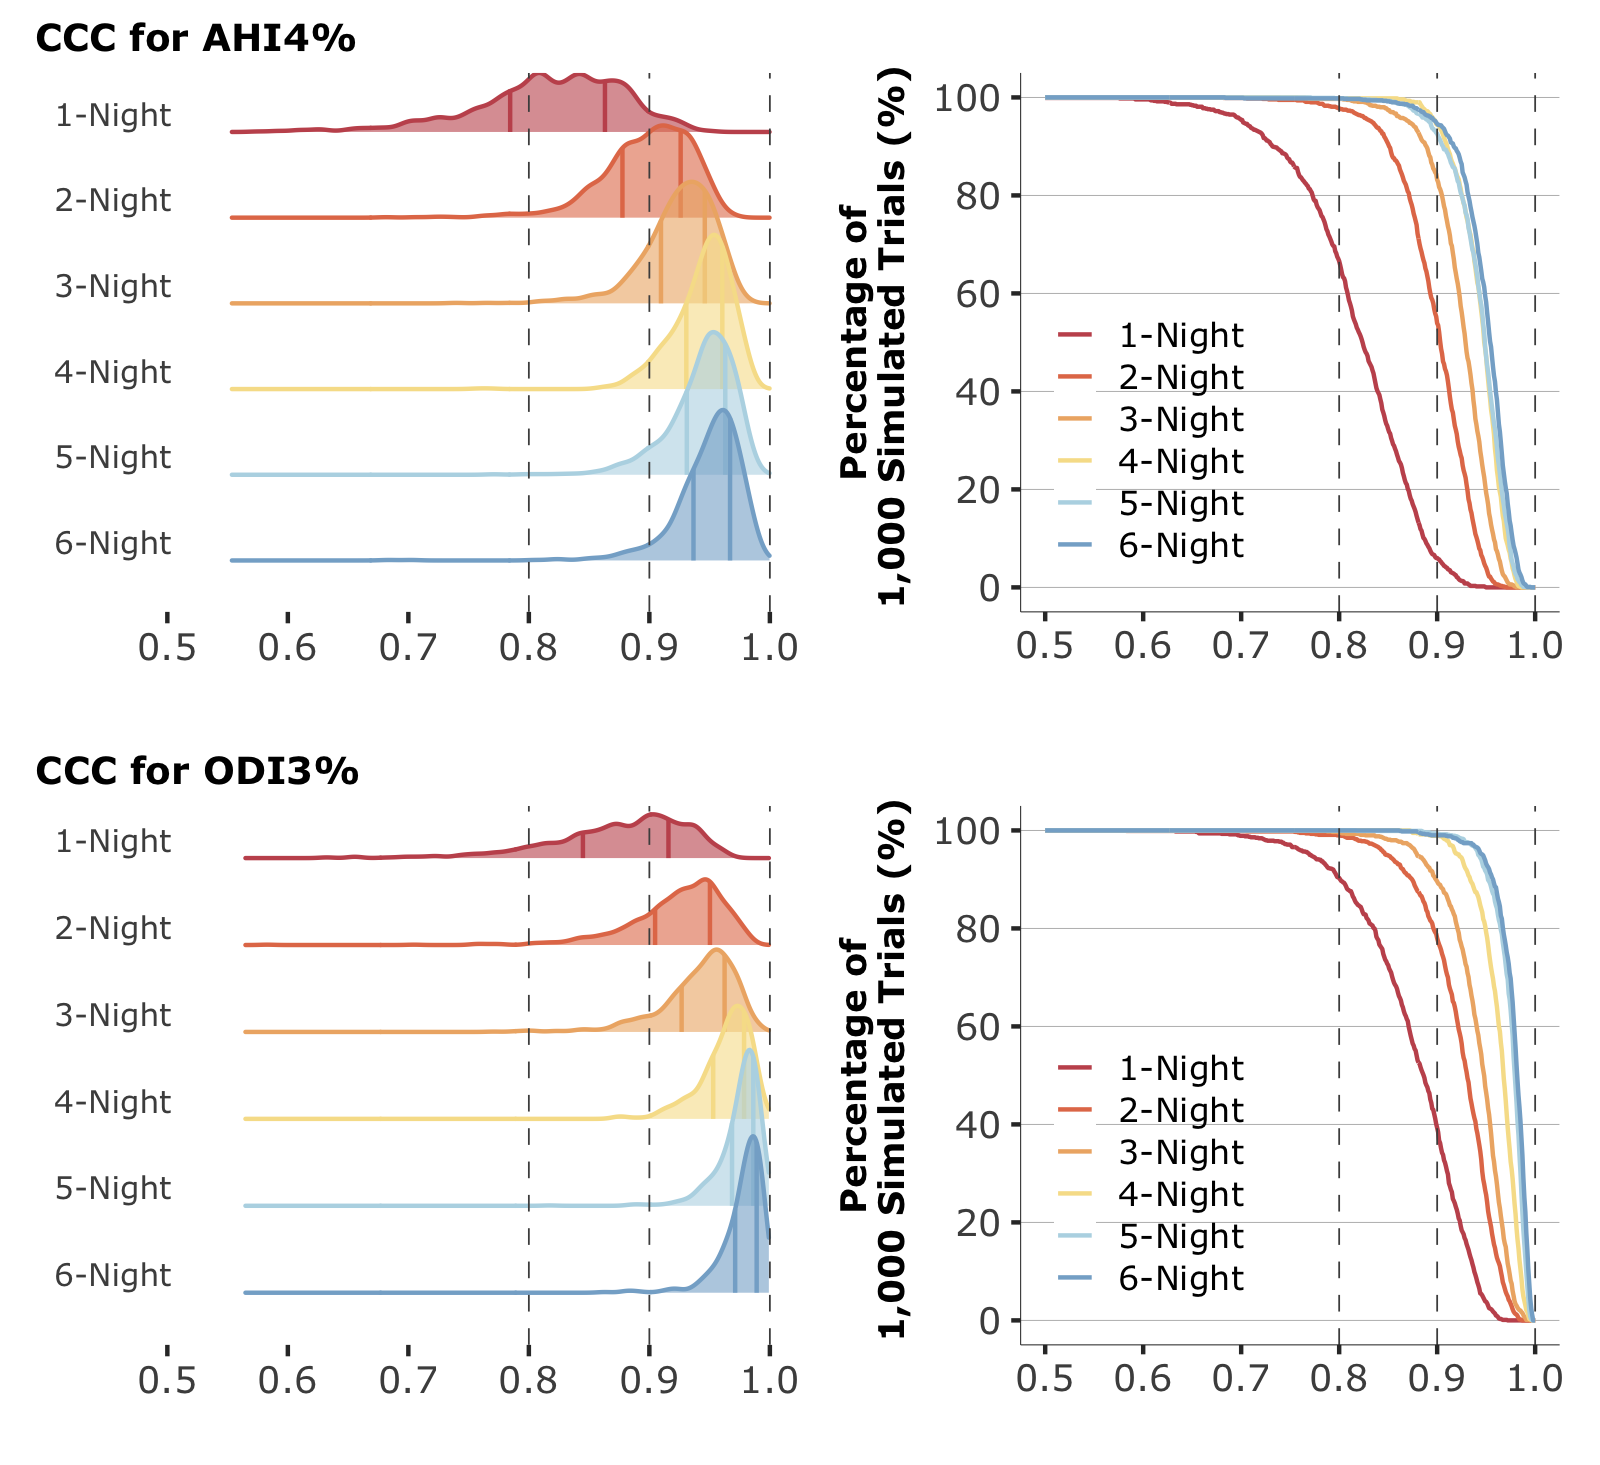
Figure 4. Distribution of concordance correlation coefficient (CCC) and percentage of simulations for AHI4% and ODI3% Across N-night Averages.
The plots display the distribution of CCC values for AHI4% and ODI3% from 1,000 simulated trials comparing N-night averaged with reference values. The solid vertical lines represent the interquartile range (25th to 75th percentile). The accompanying graphs show the percentage of 1,000 simulated trials corresponding to values across N-night data.
(more ...)
DISCUSSION
Overall Summary
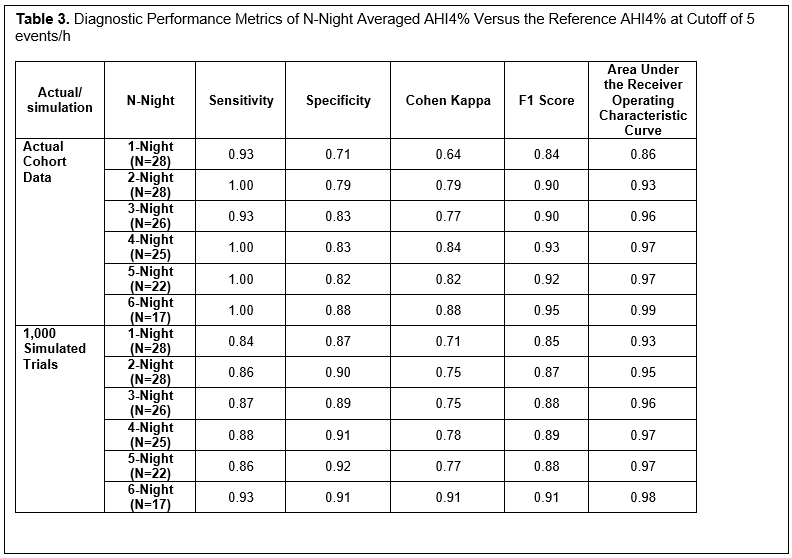
This study is the first to assess AHI night-to-night variability up to 10 nights using a novel PPG-based wearable in a dental clinic population with no or mild OSA. BR night-to-night variability improved with multi-night recordings, with a 2-night AHI4% average yielding higher sensitivity, F1 score, and AUC-ROC. Performance gains plateaued on the third night, suggesting diminishing returns with additional nights of testing. Agreement analysis demonstrated a significant increase of CCC to 0.96 for AHI4% and 0.98 for ODI3% with 3-night testing. Bootstrapping simulations further supported these findings, showing that although 2 nights of BR recording substantially improved classification reliability, a plateau in performance gain was observed by the third night, suggesting that 3 nights are optimal for mitigating the effect of night-to-night variability in individuals with no to mild OSA.
Using the Multi-Night Capability of Novel Sleep Technologies to Mitigate the Effect of Night-to-Night Variability
Despite the rapid evolution of the landscape in OSA diagnostics, the extent of AHI night-to-night variability measured by the novel medical-grade sleep technologies remains largely unexplored. Investigating this variability is crucial for understanding the optimal use of these emerging tools in real-world scenarios. A recent large-scale study utilizing the Withings Sleep Analyzer (Withings, Issy-les-Moulineaux, France), an under-the-mattress device, revealed that a single-night assessment resulted in a misdiagnosis rate of 20% in the overall sample and almost 50% in cases of mild to moderate OSA.37,38 Unlike BR, which directly measures PPG and SpO2, the Withings Sleep Analyzer employs ballistocardiography to derive respiratory movement, lacking SpO2 data input.39 Although the absence of SpO2 data can potentially undermine the device’s performance, extending the monitoring period to 14 nights has been shown to substantially reduce the false-negative rate from 17% (single-night recording) to 2%, thereby minimizing the effect of night-to-night variability.37 Leveraging an F1 score threshold of 0.90, Lechat et al. proposed a minimum of 7 nights of monitoring with Withings Sleep Analyzer for reliable OSA classification.37
Another novel sleep technology that has been investigated for night-to-night variability is the non-PPG-based Sunrise wearable (Sunrise, Belgium), which quantifies mandibular movement using accelerometry and gyroscope sensors to derive AHI.19,40 A recent study involving participants who completed a 3-night home sleep recording demonstrated that relying on a single-night recording led to overtreatment and undertreatment rates of 13.5% and 6.0%, respectively, compared with the 3-night average.19 The study authors concluded that 3 nights of assessment using Sunrise can reduce potential OSA misdiagnosis and severity misclassification.19
Strengths and Limitations
The current study possesses several notable strengths. It represents the first study using a PPG-based wearable to investigate AHI night-to-night variability, offering new insights into multi-night sleep testing. In addition, this study incorporated BR recording for up to 10 nights, enabling a more comprehensive assessment of nocturnal AHI variability. To date, very few studies have assessed night-to-night variability for more than 6 nights.13,37,41,42 Among them, two used non-PSG devices, with one using a pulse oximeter and another an under-mattress device.37,41 Furthermore, conducting measurements in a home environment enhances the real-world applicability, because it captures sleep patterns under natural sleeping conditions while minimizing the potential disruptions associated with in-laboratory PSG, such as the "first-night effect”. 25,26
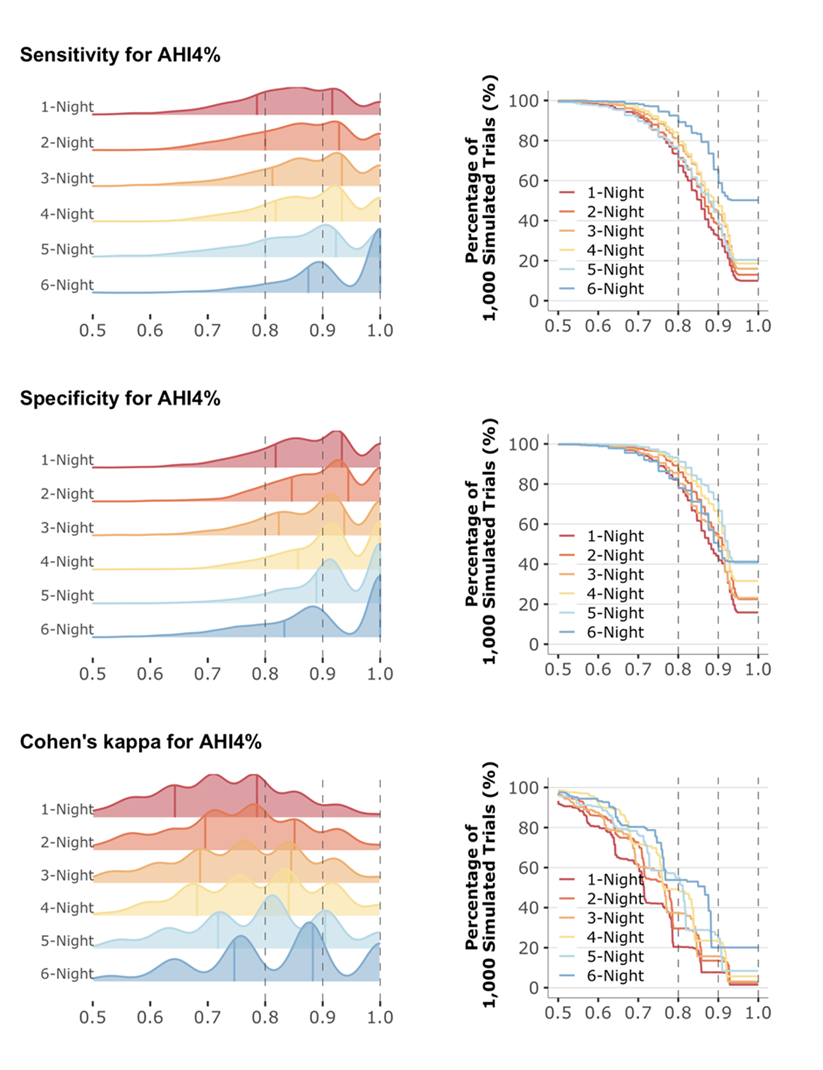
However, several methodologic limitations warrant acknowledgment. The primary limitation is the reliance on multi-night average AHI as the reference benchmark without concurrent PSG validation. Although this approach is suboptimal, it is consistent with methodologies used in prior research on night-to-night variability.10,37 Additionally, this study's statistical power was constrained by its relatively small sample size. To address this constraint, bootstrapped simulations were employed to produce more robust variance estimates. However, bootstrapping also amplified the effects of clustered or multimodal distributions for metrics, such as sensitivity, specificity, and Cohen kappa, making these metrics difficult to use for such evaluation (Figure S2). The study cohort was also characterized by a relatively young age and a predominance of female participants. Last, the analysis was restricted to individuals with no or mild OSA due to the lack of adequate patients with moderate-to-severe OSA in this dental clinic cohort. Prior research indicates that OSA night-to-night variability is more pronounced in mild-to-moderate cases.10,26,37,41,42 Future investigations involving older populations and encompassing the full spectrum of OSA severity are warranted to further elucidate the optimal use of wearables to reduce the effect of night-to-night variability.
In this study, AUC-ROC, F1 score, and CCC were used for the assessment of diagnostic convergence. From the methodological perspective, there remains a lack of well-defined standardized statistical metrics and universally accepted thresholds for assessing multi-night testing protocols. Standardization of the statistical framework will be critical in ensuring the translation of diagnostic sleep technologies into successful patient-centered practice.
Clinical Implications
Determining the optimal number of nights required to diminish the effect of night-to-night variability using novel sleep technologies remains a research priority.43 Although multi-night sleep monitoring can reduce the risk of missed OSA diagnoses, excessive testing could potentially elevate false-positive results, leading to unnecessary therapeutic interventions, added inconvenience, higher healthcare costs, increased reluctance to undergo testing, or reduced adherence to diagnostic protocols.9 Provided the prominent heterogeneity among these cutting-edge OSA-detecting technologies because of widely varied operational mechanisms, device specifications, sensing locations, and artificial intelligence-driven analytical algorithms, each sleep technology likely requires separate evaluation to establish the device-specific optimal number of testing nights.
Over the past decade, there has been growing recognition of the vital role dental sleep specialists play in OSA screening and therapeutic management.29,30 Recent research supports this perspective, with a comprehensive meta-analysis of 42 studies substantiating the efficacy of OAT in treating OSA across all severity levels.44 The advent of OSA-detecting sleep technologies is expected to positively affect dental sleep medicine practice, offering new opportunities for OSA assessment and management. For dental sleep specialists, the understanding of AHI night-to-night variability and the mitigation strategies will help streamline OAT assessment and longitudinal monitoring workflows for optimizing therapeutic outcomes.45
CONCLUSIONS
This pilot investigation, conducted in a dental sleep clinic, demonstrated that multiple-night BR testing improved result reliability, and the performance gains leveled off by the third night, indicating that 3 nights of recording can effectively attenuate the effect of night-to-night variability in individuals with no to mild OSA. Future studies should prioritize the standardization of statistical frameworks for multi-night assessment and expand to include patients across the full spectrum of OSA severity from diverse patient populations.
REFERENCES
1. Senaratna CV, Perret JL, Lodge CJ, et al. Prevalence of obstructive sleep apnea in the general population: a systematic review. Sleep Med Rev. 2017;34:70–81.2. Gottlieb DJ, Punjabi NM. Diagnosis and management of obstructive sleep apnea: a review. JAMA. 2020;323(14):1389.
3. Young T, Palta M, Dempsey J, Skatrud J, Weber S, Badr S. The occurrence of sleep-disordered breathing among middle-aged adults. N Engl J Med. 1993;328(17):1230–1235.
4. Peppard PE, Young T, Barnet JH, Palta M, Hagen EW, Hla KM. Increased Prevalence of Sleep-Disordered Breathing in Adults. Am J Epidemiol. 2013;177(9):1006–014.
5. Chowdhuri S, Quan SF, Almeida F, et al. An official American Thoracic Society research statement: impact of mild obstructive sleep apnea in adults. Am J Respir Crit Care Med. 2016;193(9):e37–e54.
6. Epstein LJ, Kristo D, Strollo PJ, et al. Clinical guideline for the evaluation, management and long-term care of obstructive sleep apnea in adults. J Clin Sleep Med. 2009;05(03):263–276.
7. Kapur VK, Auckley DH, Chowdhuri S, et al. Clinical practice guideline for diagnostic testing for adult obstructive sleep apnea: an American Academy of Sleep Medicine clinical practice guideline. J Clin Sleep Med. 2017;13(03):479–504.
8. Grandner MA, Lujan MR, Ghani SB. Sleep-tracking technology in scientific research: looking to the future. Sleep. 2021;44(5):zsab071.
9. Roeder M, Bradicich M, Schwarz EI, et al. Night-to-night variability of respiratory events in obstructive sleep apnoea: a systematic review and meta-analysis. Thorax. 2020;75(12):1095–1102.
10. Lechat B, Scott H, Manners J, et al. Multi-night measurement for diagnosis and simplified monitoring of obstructive sleep apnoea. Sleep Med Rev. 2023;72:101843.
11. Schwarz EI. Night-to-night variability in obstructive sleep apnoea: when might a multi-night measurement be helpful? Expert Rev Respir Med. 2025;19(2):73–76.
12. Neill AM, Angus SM, Sajkov D, McEvoy RD. Effects of sleep posture on upper airway stability in patients with obstructive sleep apnea. Am J Respir Crit Care Med. 1997;155(1):199–204.
13. Fietze I, Dingli K, Diefenbach K, et al. Night-to-night variation of the oxygen desaturation index in sleep apnoea syndrome. Eur Respir J. 2004;24(6):987–993.
14. White LH, Lyons OD, Yadollahi A, Ryan CM, Bradley TD. Night-to-night variability in obstructive sleep apnea severity: relationship to overnight rostral fluid shift. J Clin Sleep Med. 2015;11(02):149–156.
15. Varol Y, Anar C, Tuzel OE, Guclu SZ, Ucar ZZ. The impact of active and former smoking on the severity of obstructive sleep apnea. Sleep Breath. 2015;19(4):1279–1284.
16. Zhu K, Bradley TD, Patel M, Alshaer H. Influence of head position on obstructive sleep apnea severity. Sleep Breath. 2017;21(4):821–828.
17. Thomas RJ, Chen S, Eden UT, Prerau MJ. Quantifying statistical uncertainty in metrics of sleep disordered breathing. Sleep Med. 2020;65:161–169.
18. Tolbert TM, Schoenholz RL, Parekh A, et al. Night-to-night reliability and agreement of obstructive sleep apnea pathophysiologic mechanisms estimated with phenotyping using polysomnography in cognitively normal elderly participants. Sleep. 2023;46(8):zsad058.https://doi.org/10.5665/sleep.2948.
19. Martinot JB, Le-Dong NN, Tamisier R, Bailly S, Pépin JL. Determinants of apnea-hypopnea index variability during home sleep testing. Sleep Med. 2023;111:86–93.
20. Tschopp S, Wimmer W, Caversaccio M, Borner U, Tschopp K. Night-to-night variability in obstructive sleep apnea using peripheral arterial tonometry: a case for multiple night testing. J Clin Sleep Med. 2021;17(9):1751–1758.
21. Maestri R, La Rovere MT, Robbi E, Pinna GD. Night-to-night repeatability of measurements of nocturnal breathing disorders in clinically stable chronic heart failure patients. Sleep Breath. 2011;15(4):673–678.
22. Zeidler MR, Santiago V, Dzierzewski JM, Mitchell MN, Santiago S, Martin JL. Predictors of Obstructive Sleep Apnea on Polysomnography after a Technically Inadequate or Normal Home Sleep Test. J Clin Sleep Med. 2015;11(11):1313–1318.
23. Sweetman AM, Lack LC, Catcheside PG, et al. Developing a successful treatment for co-morbid insomnia and sleep apnoea. Sleep Med Rev. 2017;33:28–38.
24. Le Bon O, Hoffmann G, Tecco J, et al. Mild to moderate sleep respiratory events. Chest. 2000;118(2):353–359.
25. Newell J, Mairesse O, Verbanck P, Neu D. Is a one-night stay in the lab really enough to conclude? First-night effect and night-to-night variability in polysomnographic recordings among different clinical population samples. Psychiatry Res. 2012;200(2-3):795–801.
26. Punjabi NM, Patil S, Crainiceanu C, Aurora RN. Variability and misclassification of sleep apnea severity based on multi-night testing. Chest. 2020;158(1):365–373.
27. Chiang AA, Jerkins E, Holfinger S, et al. OSA diagnosis goes wearable: are the latest devices ready to shine? J Clin Sleep Med. 2024;20(11):1823–1838.
28. Tsai CW, Leung L, Chen HT, Kwok KC, Lee M, Chiang AA. Emerging biosensor technologies for obstructive sleep apnea: a comprehensive overview and future prospects. In: Pandya A, Mahato K, ed. Biosensing the Future: Wearable, Ingestible and Implantable Technologies for Health and Wellness Monitoring Part B. Progress in Molecular Biology and Translational Science. Elsevier. 2025;216:185–232.
29. Behrents RG, Shelgikar AV, Conley RS, et al. Obstructive sleep apnea and orthodontics: An American Association of Orthodontists White Paper. Am J Orthod Dentofacial Orthop. 2019;156(1):13–28.e1.
30. Kazmierski RH. Obstructive sleep apnea: What is an orthodontist’s role? Prog Orthod. 2024;25(1):21.
31. U.S. Food & Drug Administration. K222579. Belun Sleep System BLS-100 510(k) premarket notification. https://www.accessdata.fda.gov/cdrh_docs/pdf22/K222579.pdf. Published February 23, 2023. Accessed August 27, 2024.
32. U.S. Food & Drug Administration. K211407. Belun Ring BLR-100X 510(k) premarket notification. https://www.accessdata.fda.gov/cdrh_docs/pdf21/K211407.pdf. Published October 21, 2021. Accessed August 27, 2024.
33. Strumpf Z, Gu W, Tsai CW, et al. Belun Ring (Belun Sleep System BLS-100): Deep learning-facilitated wearable enables obstructive sleep apnea detection, apnea severity categorization, and sleep stage classification in patients suspected of obstructive sleep apnea. Sleep Health. 2023;9(4):430–440.
34. Tsai CW, Gu W, Yeh E, et al. 0954 Correlation of pulse rate variability (PRV) and heart rate variability (HRV) metrics during sleep in subjects suspected of OSA. In: Sleep 2023. Vol 46. Indianapolis, Indiana; 2023:A420–A421.
35. Lechat B, Nguyen DP, Reynolds A, et al. Single-night diagnosis of sleep apnea contributes to inconsistent cardiovascular outcome findings. Chest. 2023;164(1):231–240.
36. Kulesa A, Krzywinski M, Blainey P, Altman N. Sampling distributions and the bootstrap. Nat Methods. 2015;12(6):477–478.
37. Lechat B, Naik G, Reynolds A, et al. Multinight prevalence, variability, and diagnostic misclassification of obstructive sleep apnea. Am J Respir Crit Care Med. 2022;205(5):563–569.
38. U.S. Food & Drug Administration. K231667. Withings Sleep Rx 510(k) premarket notification. https://www.accessdata.fda.gov/cdrh_docs/pdf23/K231667.pdf. Published September 6, 2024. Accessed August 27, 2024.
39. Sadek I, Biswas J, Abdulrazak B. Ballistocardiogram signal processing: a review. Health Inf Sci Syst. 2019;7(1):10.
40. U.S. Food & Drug Administration. K222262. Sunrise 510(k) premarket notification. https://www.accessdata.fda.gov/cdrh_docs/pdf22/K222262.pdf. Published December 22, 2022. Accessed August 27, 2024.
41. Stöberl AS, Schwarz EI, Haile SR, et al. Nightâtoânight variability of obstructive sleep apnea. J Sleep Res. 2017;26(6):782–788.
42. Prasad B, Usmani S, Steffen AD, et al. Short-Term Variability in Apnea-Hypopnea Index during Extended Home Portable Monitoring. J Clin Sleep Med. 2016;12(06):855–863.
43. Simonds AK. How many more nights? Diagnosing and classifying obstructive sleep apnea using multinight home studies. Am J Respir Crit Care Med. 2022;205(5):491–492.
44. Liao J, Shi Y, Gao X, et al. Efficacy of oral appliance for mild, moderate, and severe obstructive sleep apnea: a meta-analysis. Otolaryngol Head Neck Surg. 2024; 170(5):1270–1279.
45. Metz JE, Attarian HP, Harrison MC, Blank JE, Takacs CM, Smith DL, Gozal D. High-resolution pulse oximetry and titration of a mandibular advancement device for obstructive sleep apnea. Front Neurol. 2019 Jul 17;10:757.
SUBMISSION & CORRESPONDENCE INFORMATION
Submitted May 1, 2025
Submitted in final revised form July 24, 2025
Accepted for publication August 31, 2025
Address correspondence to: Ambrose A. Chiang, MD, FCCP, FAASM. Email: Ambrose.chiang@va.gov
DISCLOSURE STATEMENT
Drs. Juan Martin Palomo, Brittany Link, and Pai-Lien Chen have no financial conflicts of interest.Drs. Chih-Wei Tsai, Lydia Leung, and Cynthia Cheung are Belun Technology Company employees.
Dr. Ambrose A. Chiang has received research grants from Belun for conducting validation studies at University Hospitals Cleveland Medical Center but otherwise has no financial conflicts of interest.
Supplementary Information
Simulations
Sensitivity Analysis
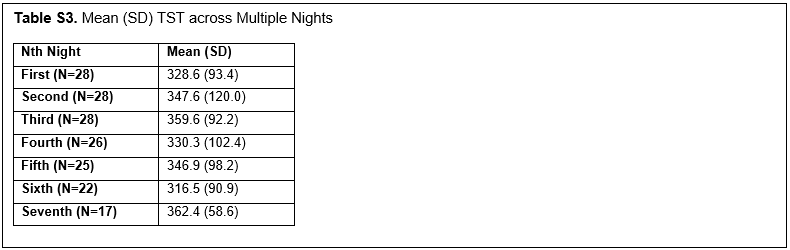
The distribution of Total Sleep Time (TST)
Figure S1. Bootstrap Methodology Overview
(more ...)
Table S1. Percentage of Nights with TST Exceeding 1, 2, 3, and 4 Hours |
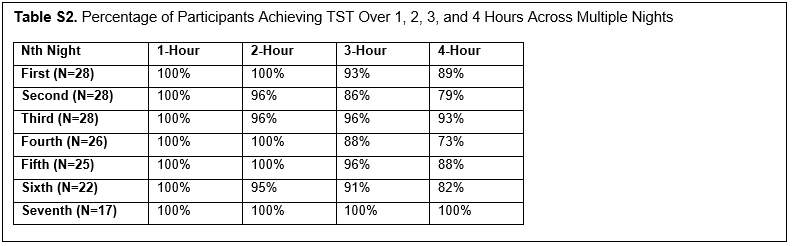
Table S2. Percentage of Participants Achieving TST Over 1, 2, 3, and 4 Hours Across Multiple Nights |